Last reviewed: September 2026 · By the HVAC Brief Editorial Team · Our sourcing and editorial standards
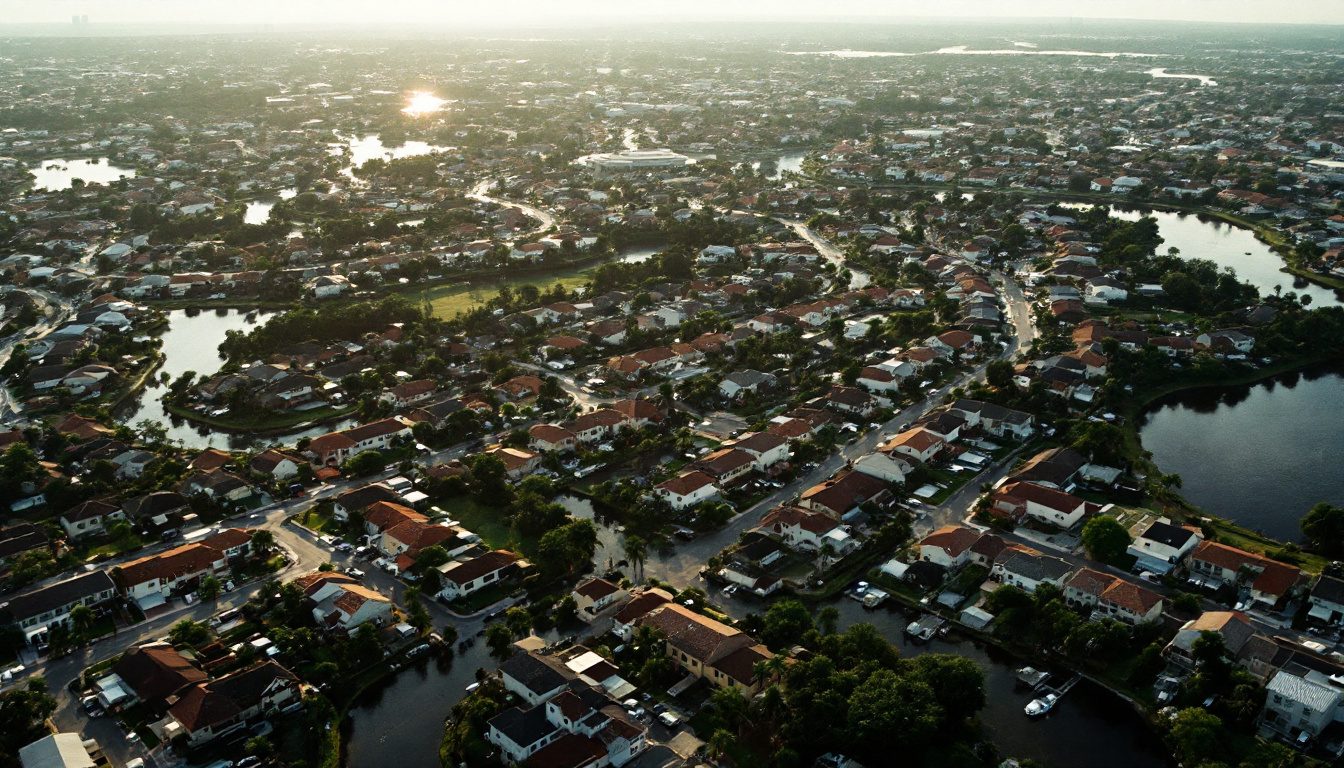
Cape Coral-Fort Myers, FL is the most HVAC-dependent metro in the United States: plumbing, heating and air-conditioning contractors take 2.7 times their national share of local jobs. Four of the six most concentrated metros are on Florida’s Gulf Coast.
Fresno, CA grew its industry workforce 137% in a decade. New York-Newark-Jersey City, NY-NJ employs the most, 67,119.
State figures hide where the trade is actually concentrated. This page uses the Quarterly Census of Employment and Wages at metro level to show where plumbing, heating and air-conditioning contractors employ the most people, where they matter most to the local economy, and where they are growing.
Where the industry matters most
| Metro area | Employment | Establishments | Average pay | Location quotient | Change since 2014 |
|---|---|---|---|---|---|
| Cape Coral-Fort Myers, FL | 6,678 | 632 | $66,867 | 2.69 | +90% |
| Kalamazoo-Portage, MI | 2,207 | 57 | $81,971 | 2.20 | +59% |
| Kennewick-Richland, WA | 2,279 | 95 | $96,089 | 2.01 | +86% |
| North Port-Bradenton-Sarasota, FL | 5,552 | 590 | $68,899 | 2.00 | +96% |
| Naples-Marco Island, FL | 2,811 | 272 | $64,752 | 1.97 | +86% |
| Cedar Rapids, IA | 2,198 | 90 | $77,392 | 1.91 | +49% |
| Fort Collins-Loveland, CO | 2,674 | 200 | $73,612 | 1.84 | +34% |
| Palm Bay-Melbourne-Titusville, FL | 3,488 | 308 | $65,553 | 1.73 | +93% |
| Pensacola-Ferry Pass-Brent, FL | 2,609 | 228 | $63,617 | 1.66 | +70% |
| Mobile, AL | 2,356 | 164 | $77,041 | 1.62 | +28% |
| Raleigh-Cary, NC | 9,762 | 697 | $75,740 | 1.61 | +78% |
| Ogden, UT | 3,520 | 318 | $70,236 | 1.57 | +56% |
The location quotient measures specialisation rather than size. Cape Coral-Fort Myers, FL at 2.69 leads, and the Gulf Coast of Florida dominates the top of the list. These are fast-growing, warm metros with a large stock of homes depending on air conditioning and steady new construction. A location quotient describes how concentrated an industry is; it does not by itself explain why.
The largest metros
| Metro area | Employment | Establishments | Average pay | Location quotient | Change since 2014 |
|---|---|---|---|---|---|
| New York-Newark-Jersey City, NY-NJ | 67,119 | 7,582 | $86,752 | 0.85 | – |
| Los Angeles-Long Beach-Anaheim, CA | 37,363 | 4,014 | $84,580 | 0.73 | +39% |
| Dallas-Fort Worth-Arlington, TX | 36,523 | 2,420 | $79,981 | 1.10 | +60% |
| Miami-Fort Lauderdale-West Palm Beach, FL | 24,389 | 2,733 | $65,361 | 1.05 | +54% |
| Philadelphia-Camden-Wilmington, PA-NJ-DE-MD | 23,911 | 2,124 | $92,524 | 1.00 | +34% |
| Seattle-Tacoma-Bellevue, WA | 17,148 | 1,024 | $103,713 | 0.99 | +55% |
| San Francisco-Oakland-Fremont, CA | 16,301 | 1,257 | $109,795 | 0.82 | -0% |
| Tampa-St. Petersburg-Clearwater, FL | 16,153 | 1,669 | $64,494 | 1.36 | +64% |
| Riverside-San Bernardino-Ontario, CA | 15,028 | 1,500 | $73,835 | 1.07 | +69% |
| Austin-Round Rock-San Marcos, TX | 13,895 | 850 | $86,592 | 1.32 | – |
| Orlando-Kissimmee-Sanford, FL | 13,532 | 1,030 | $68,257 | 1.17 | +74% |
| San Diego-Chula Vista-Carlsbad, CA | 13,121 | 1,124 | $84,312 | 1.03 | +44% |
| Detroit-Warren-Dearborn, MI | 12,178 | 1,080 | $88,015 | 0.77 | +25% |
| Las Vegas-Henderson-North Las Vegas, NV | 11,192 | 690 | $78,794 | 1.20 | +93% |
| Sacramento-Roseville-Folsom, CA | 10,696 | 828 | $84,736 | 1.19 | +79% |
The fastest growing
| Metro area | Employment | Establishments | Average pay | Location quotient | Change since 2014 |
|---|---|---|---|---|---|
| Fresno, CA | 3,658 | 291 | $71,729 | 0.91 | +137% |
| Provo-Orem-Lehi, UT | 2,958 | 314 | $68,036 | 1.19 | +126% |
| North Port-Bradenton-Sarasota, FL | 5,552 | 590 | $68,899 | 2.00 | +96% |
| Palm Bay-Melbourne-Titusville, FL | 3,488 | 308 | $65,553 | 1.73 | +93% |
| Las Vegas-Henderson-North Las Vegas, NV | 11,192 | 690 | $78,794 | 1.20 | +93% |
| Cape Coral-Fort Myers, FL | 6,678 | 632 | $66,867 | 2.69 | +90% |
| Naples-Marco Island, FL | 2,811 | 272 | $64,752 | 1.97 | +86% |
| Kennewick-Richland, WA | 2,279 | 95 | $96,089 | 2.01 | +86% |
| Tucson, AZ | 4,340 | 364 | $64,729 | 1.35 | +83% |
| Sacramento-Roseville-Folsom, CA | 10,696 | 828 | $84,736 | 1.19 | +79% |
| Raleigh-Cary, NC | 9,762 | 697 | $75,740 | 1.61 | +78% |
| Salt Lake City-Murray, UT | 7,914 | 625 | $77,027 | 1.17 | +76% |
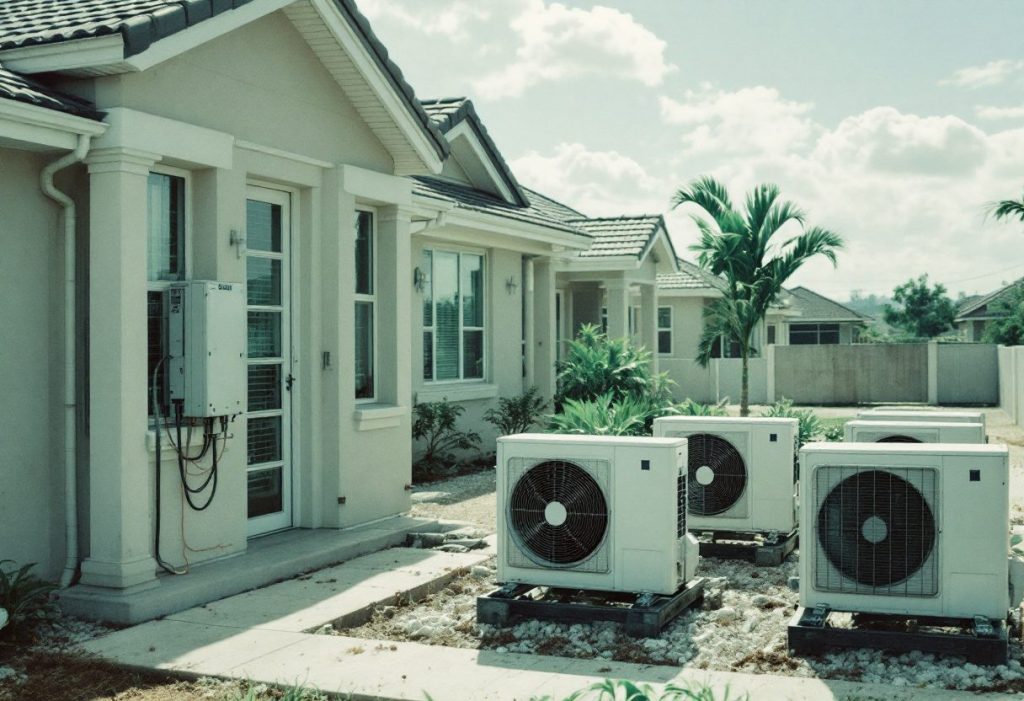
Growth concentrates in California’s Central Valley, the Mountain West and Florida, the same regions where our state employment index records the largest gains.
Where it pays
| Metro area | Employment | Establishments | Average pay | Location quotient | Change since 2014 |
|---|---|---|---|---|---|
| San Francisco-Oakland-Fremont, CA | 16,301 | 1,257 | $109,795 | 0.82 | -0% |
| Seattle-Tacoma-Bellevue, WA | 17,148 | 1,024 | $103,713 | 0.99 | +55% |
| Kennewick-Richland, WA | 2,279 | 95 | $96,089 | 2.01 | +86% |
| Philadelphia-Camden-Wilmington, PA-NJ-DE-MD | 23,911 | 2,124 | $92,524 | 1.00 | +34% |
| Milwaukee-Waukesha, WI | 6,800 | 432 | $91,671 | 1.00 | – |
| Santa Rosa-Petaluma, CA | 2,066 | 273 | $89,964 | 1.20 | +57% |
| Hartford-West Hartford-East Hartford, CT | 4,783 | 434 | $89,479 | 0.97 | +27% |
| Urban Honolulu, HI | 3,549 | 322 | $89,261 | 0.94 | +31% |
| Worcester, MA | 3,084 | 329 | $89,045 | 1.06 | +38% |
| Detroit-Warren-Dearborn, MI | 12,178 | 1,080 | $88,015 | 0.77 | +25% |
Pay here is the average across every employee of these firms, including office staff, not technician wages. Technician pay by metro is in our technician pay analysis, from a different survey.
Frequently asked questions
Which metro has the most HVAC and plumbing contractor jobs?
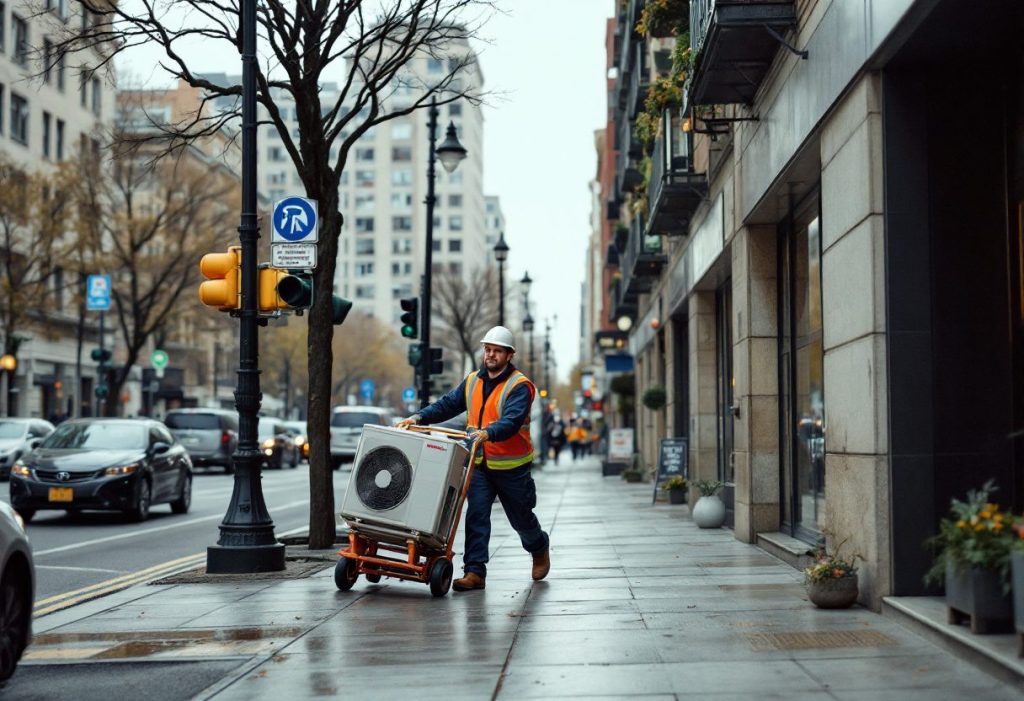
New York-Newark-Jersey City, NY-NJ, with 67,119 private employees in 2024, followed by Los Angeles-Long Beach-Anaheim, CA and Dallas-Fort Worth-Arlington, TX. Size tracks population closely.
Which metro depends most on HVAC and plumbing contracting?
Cape Coral-Fort Myers, FL, with a location quotient of 2.69: the industry’s share of local private employment is 2.7 times its national share. Four of the six most concentrated metros are on Florida’s Gulf Coast.
Where is HVAC contractor employment growing fastest?
Fresno, CA (+137% since 2014) and Provo-Orem-Lehi, UT (+126%) lead among metros with at least 2,000 employed, followed by several fast-growing Florida and Mountain West metros.
Where does HVAC contracting pay most?
San Francisco-Oakland-Fremont, CA at $109,795 average annual pay in 2024, then Seattle-Tacoma-Bellevue, WA at $103,713. Pay tracks local cost of living.
What is a location quotient?
It compares the industry’s share of a metro’s private employment with its share nationally. A value above 1.0 means the metro is more specialised in the industry than the country as a whole.
Does this include plumbers?
Yes. The industry code, NAICS 238220, combines plumbing, heating and air-conditioning contractors, and no federal series separates them.
Why are some metros missing?
QCEW withholds figures where a single employer could be identified. Of 393 metros, 224 have published figures for this industry, and this page focuses on the 60 with at least 2,000 employees.
Methodology and limitations
- Source: BLS Quarterly Census of Employment and Wages, 2024 annual averages and 2014 for growth, NAICS 23822, private ownership, metropolitan statistical areas. Area names from the BLS QCEW area titles file.
- NAICS 238220 is Plumbing, Heating, and Air-Conditioning Contractors; plumbing is included and cannot be separated.
- QCEW suppresses metro cells where an employer could be identified. 224 metros have published 2024 figures; tables show metros with at least 2,000 employees so that rankings are not driven by very small bases.
- Location quotients and average annual pay are BLS’s published values. Growth compares 2014 and 2024 annual average employment where both are published.
- Metro boundaries follow the delineations BLS uses for each year; some metros were redefined over the decade, which can affect growth figures.
Sources
- US Bureau of Labor Statistics, Quarterly Census of Employment and Wages, open data files for NAICS 23822, annual 2014 to 2024 and quarterly 2025 Q1 to 2026 Q1.
- US Bureau of Labor Statistics, QCEW area titles.
The HVAC Brief is an independent trade publication. We do not sell equipment, take manufacturer advertising, or accept payment for placement in our research. Corrections welcome.
Leave a Reply