Last reviewed: September 2026 · By the HVAC Brief Editorial Team · Our sourcing and editorial standards
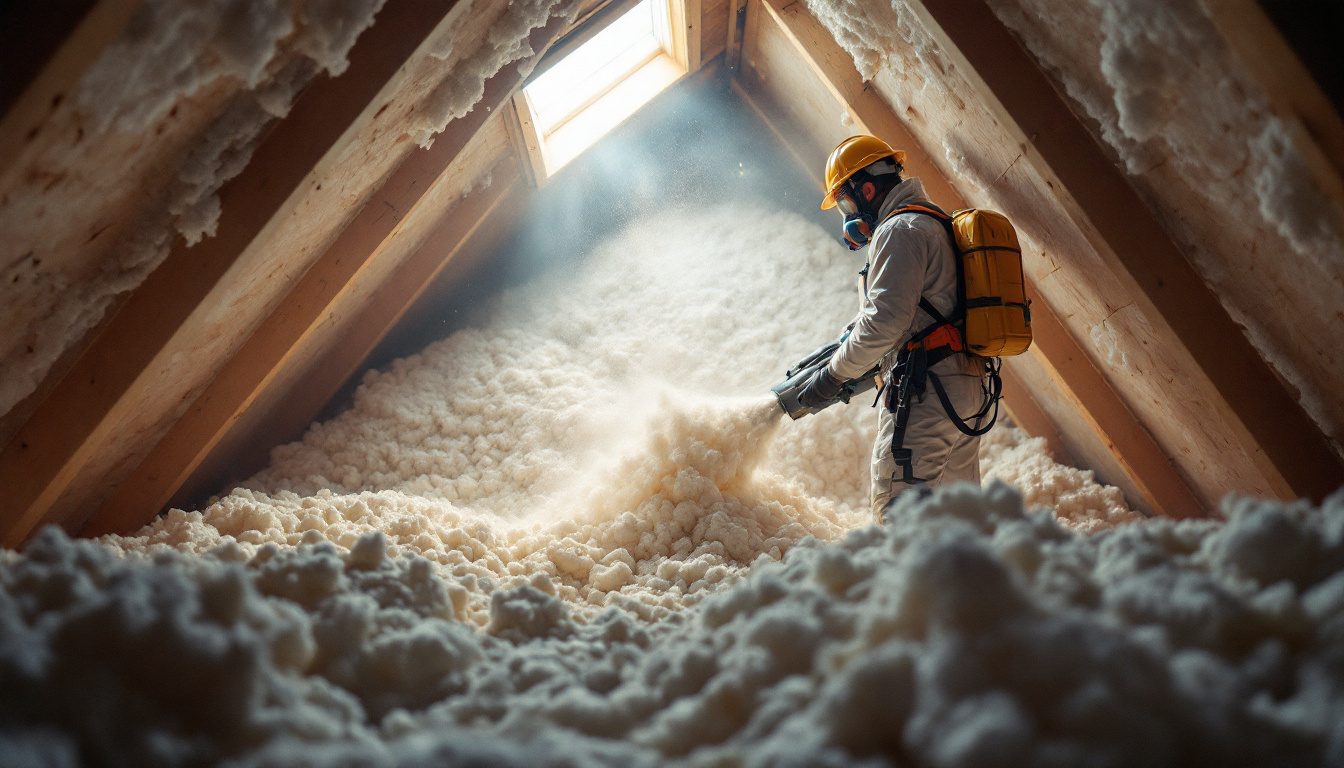
One in five US homes is poorly insulated or not insulated at all, by its occupants’ own account, and 13% are drafty all or most of the time. 35% still have single-pane windows. South-facing glass can also be a heat source when it is sized and shaded for it, the principle behind passive solar heating.
Housing age drives almost all of it: 36% of pre-1950 homes are poorly insulated against 5% of homes built since 2016. Every HVAC system works against this envelope.
Every heating and cooling decision rests on the building it serves. How much capacity a home needs, and what it costs to run, depends on how quickly heat leaks out in winter and in during summer. EIA’s Residential Energy Consumption Survey asks every household how well insulated and how drafty its home is, and what glass is in the windows.
The national picture
| Measure | Share of homes |
|---|---|
| Insulation: well insulated | 27.8% |
| Insulation: adequately insulated | 52.0% |
| Insulation: poorly insulated | 17.2% |
| Insulation: not insulated | 2.9% |
| Drafty: all the time | 4.2% |
| Drafty: most of the time | 8.4% |
| Drafty: some of the time | 42.6% |
| Drafty: never | 44.8% |
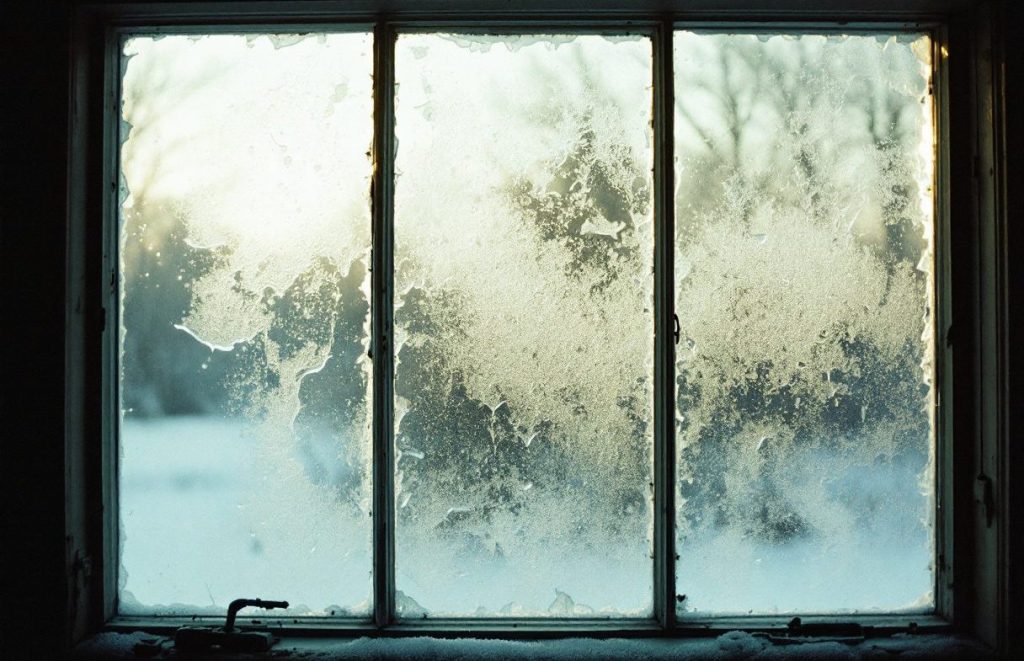
| Windows: single-pane | 35.2% |
| Windows: double-pane | 63.1% |
| Windows: triple-pane | 1.7% |
It is mostly about age
| Built | Poorly or not insulated | Drafty all or most of the time | Single-pane windows |
|---|---|---|---|
| Before 1950 | 35.5% | 19.5% | 43.0% |
| 1950s | 29.6% | 16.2% | 39.5% |
| 1960s | 24.9% | 14.4% | 38.4% |
| 1970s | 21.6% | 13.6% | 39.8% |
| 1980s | 17.0% | 10.8% | 37.3% |
| 1990s | 12.3% | 9.1% | 32.2% |
| 2000s | 8.7% | 8.5% | 24.5% |
| 2010 to 2015 | 7.2% | 5.5% | 22.4% |
| 2016 to 2020 | 5.0% | 5.2% | 18.8% |
Every measure improves steadily with newer construction. The share of homes poorly or not insulated falls from 36% before 1950 to 5% for homes built from 2016 to 2020. Drafts and single-pane windows follow the same line. That reflects energy codes tightening over decades, and it means the oldest third of the housing stock carries most of the envelope problem.
By income
| Annual household income | Poorly or not insulated | Drafty all or most of the time |
|---|---|---|
| Under $25,000 | 32.3% | 21.8% |
| $25,000 to $49,999 | 23.9% | 15.0% |
| $50,000 to $99,999 | 16.6% | 9.6% |
| $100,000 to $149,999 | 13.2% | 7.3% |
| $150,000 or more | 11.2% | 7.1% |
The envelope gap is steeply unequal. 32% of households earning under $25,000 live in a home they describe as poorly or not insulated, against 11% of those earning $150,000 or more, roughly three times the rate. Drafts follow the same gradient. The households least able to absorb high energy bills are the ones whose homes lose the most heat, which helps explain why low-income households report the highest rates of energy insecurity.
By region
| Census division | Poorly or not insulated | Single-pane windows |
|---|---|---|
| Pacific | 26.7% | 36.1% |
| Middle Atlantic | 22.9% | 30.7% |
| Mountain South | 21.4% | 36.8% |
| New England | 21.2% | 28.6% |
| East North Central | 20.0% | 31.1% |
| West South Central | 19.5% | 45.8% |
| East South Central | 18.1% | 37.1% |
| West North Central | 16.7% | 30.3% |
| Mountain North | 16.5% | 24.6% |
| South Atlantic | 16.1% | 38.7% |
What it means for HVAC
A poorly insulated home needs a larger system and runs it harder, and oversizing a system to compensate brings its own problems with humidity and short-cycling. Our explainers on insulating before replacing a system and sizing cover that. The envelope gap is also sharply unequal: renters are twice as likely as owners to live in a poorly insulated home, as our renters and owners analysis shows.
Frequently asked questions
How many US homes are poorly insulated?
20.1% of US households describe their home as poorly insulated or not insulated at all, according to EIA’s Residential Energy Consumption Survey: 17.2% poorly and 2.9% not insulated.
How many homes are drafty?
12.6% say their home is drafty all or most of the time, and a further 43% some of the time. 45% say it is never drafty.
How many homes still have single-pane windows?
35% of US homes have single-pane glass in most windows, 63% double-pane and 1.7% triple-pane.
Are newer homes better insulated?
Much better. 36% of homes built before 1950 are poorly or not insulated, against 5% of homes built from 2016 to 2020. Single-pane windows fall from 43% to 19% over the same span.
Why does insulation matter for HVAC?
The building envelope sets how much heating and cooling a home needs. A poorly insulated, drafty home needs more capacity and costs more to run with any equipment. That is why our sizing and insulation explainers recommend fixing the envelope before choosing a system size.
Is this measured or self-reported?
Self-reported. RECS asks the household how well insulated and how drafty the home is. It is a perception, not an inspection, but it is the only national measure that covers every home and it tracks housing age closely.
Methodology and limitations
- Source: EIA Residential Energy Consumption Survey 2020 public use microdata v7. Variables: ADQINSUL (level of insulation, respondent-reported), DRAFTY (how often the home is drafty), TYPEGLASS (glass in most windows), YEARMADERANGE. Weighted with NWEIGHT.
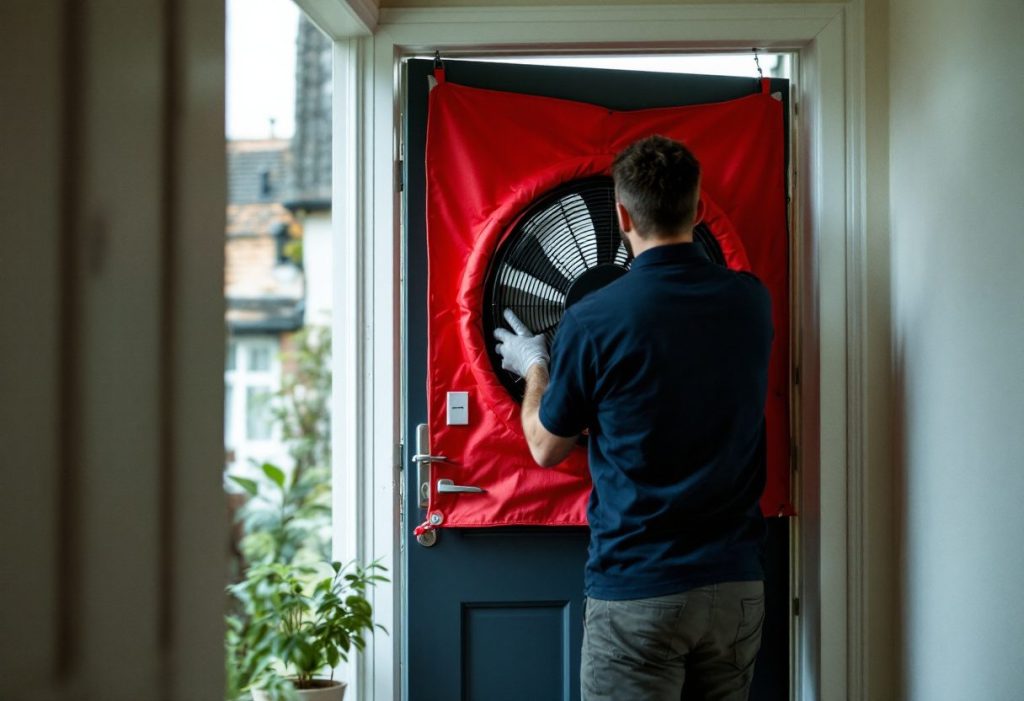
- Insulation and drafts are self-reported perceptions, not measurements from an inspection or blower-door test. They indicate condition but are not engineering values.
- Shares exclude households not asked the question. Vintage and division figures clear EIA’s reliability standard; cells that fail it are withheld.
- Standard errors use EIA’s Jackknife method with 60 replicate weights.
- Collected in 2020, the most recent RECS cycle with this detail.
Sources
- US Energy Information Administration, RECS 2020 public use microdata.
The HVAC Brief is an independent trade publication. We do not sell equipment, take manufacturer advertising, or accept payment for placement in our research. Corrections welcome.
Leave a Reply