
Last reviewed: September 2026 · By the HVAC Brief Editorial Team · Our sourcing and editorial standards
8.16 million US households could not use their air conditioning at some point in 2024, and 6.83 million could not use their heating. Both figures are up sharply on 2020, by 29% and 39%. That came in a year when cooling demand ran high: our cooling degree day index puts 2026 at 25% above normal. The burden falls unevenly: renters are twice as likely as owners to live in a poorly insulated home, as our renters and owners analysis shows.
In total 43.56 million households, 32.9% of the country, reported some form of energy insecurity. 32.89 million reduced or went without food or medicine to pay an energy bill.
EIA asks households directly whether their heating or cooling stopped working and stayed broken, and whether they went without other necessities to keep the power on. The answers arrived in the 2024 Residential Energy Consumption Survey preliminary tables. For a trade that installs and services this equipment, it is the most direct available measure of what happens when the equipment fails and the money is not there.
The 2024 numbers
| Households reporting | Millions | Share of US households |
|---|---|---|
| Any household energy insecurity | 43.56 | 32.9% |
| Reducing or forgoing food or medicine to pay energy costs | 32.89 | 24.8% |
| Leaving home at an unhealthy temperature | 17.55 | 13.2% |
| Receiving a disconnect or delivery-stop notice | 16.19 | 12.2% |
| Unable to use air-conditioning equipment | 8.16 | 6.2% |
| Unable to use heating equipment | 6.83 | 5.2% |
Base is 132.54 million primary occupied housing units. Households can report more than one, so the components do not sum to the total.
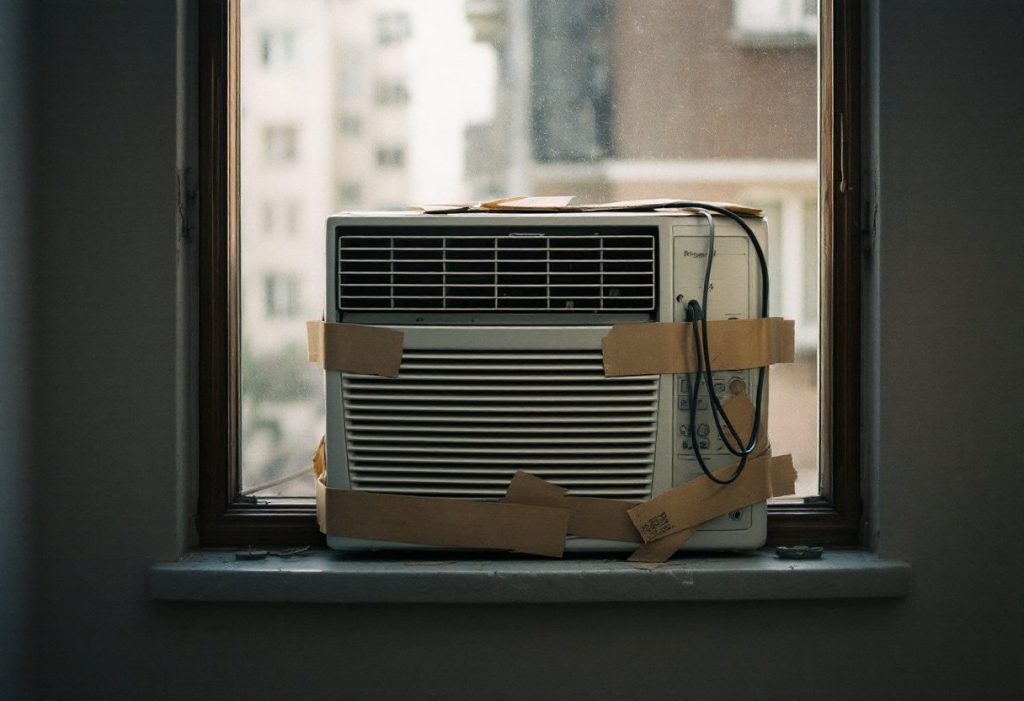
The equipment measures, 2020 against 2024
Two of these measures can be compared across survey cycles without qualification. EIA defines inability to use heating or cooling equipment the same way in both: the equipment was broken and the household could not have it repaired, or the fuel or electricity supply was cut for non-payment. The 2020 figures below are computed from the RECS 2020 public microdata using that construction.
| Measure | 2020 | 2024 | Change |
|---|---|---|---|
| Unable to use air-conditioning equipment | 6.35M | 8.16M | +29% |
| Unable to use heating equipment | 4.93M | 6.83M | +39% |
| Received a disconnect notice | 12.36M | 16.19M | +31% |
| Reduced or went without food or medicine | 24.61M | 32.89M | +34% |
One comparison is deliberately absent from that table. The 2024 release reports households leaving home because of an unhealthy temperature. The 2020 questionnaire asked about keeping the home at an unhealthy temperature, which 12.20 million households reported. Those are different behaviours and the two numbers are not a trend.
The 2020 cycle was also fielded during the first year of the pandemic, when emergency utility disconnect moratoria were in force in much of the country. That plausibly held the 2020 disconnect figure down, and it is a reason to treat the disconnect comparison more cautiously than the equipment ones.
How long the equipment stays off
The 2024 preliminary tables report whether a household lost the use of its equipment, not for how long. The 2020 microdata records the number of days, and the distribution is the part worth knowing.
Among households that lost heating, the mean outage was 37.8 days and the median 5. Among those that lost air conditioning, the mean was 37.7 days and the median 10.
A mean seven times the median is a distribution with a long tail. Most affected households are out for days. A minority are out for months, and they are the households for whom a broken system is not a repair decision but a permanent condition.
In 2020, 0.97 million households reported that someone needed medical attention because the home was too cold, and 0.66 million because it was too hot.
By region, climate and income
| Region | Households (millions) | Unable to use AC | Unable to use heating | Any insecurity |
|---|---|---|---|---|
| Northeast | 22.93 | 5.1% | 4.1% | 30.0% |
| New England | 6.20 | 5.5% | 4.8% | 29.7% |
| Middle Atlantic | 16.73 | 5.0% | 3.8% | 30.1% |
| Midwest | 28.49 | 5.3% | 4.7% | 29.9% |
| East North Central | 19.47 | 4.9% | 4.5% | 30.7% |
| West North Central | 9.02 | 6.3% | 5.2% | 28.3% |
| South | 51.49 | 7.4% | 6.3% | 35.4% |
| South Atlantic | 27.38 | 6.2% | 5.1% | 32.0% |
| East South Central | 8.01 | 9.9% | 9.7% | 38.8% |
| West South Central | 16.11 | 8.3% | 6.5% | 39.6% |
| West | 29.63 | 5.6% | 4.5% | 33.5% |
| Mountain | 10.19 | 6.2% | 4.3% | 29.4% |
| Mountain North | 5.13 | 4.5% | 3.1% | 23.8% |
| Mountain South | 5.06 | 7.9% | 5.5% | 35.2% |
| Pacific | 19.44 | 5.3% | 4.5% | 35.6% |
| Climate region | Households (millions) | Unable to use AC | Unable to use heating | Any insecurity |
|---|---|---|---|---|
| Very cold/Cold | 42.10 | 4.8% | 4.4% | 28.3% |
| Mixed-humid | 42.02 | 6.6% | 6.2% | 33.7% |
| Mixed-dry/Hot-dry | 16.28 | 8.2% | 5.4% | 41.5% |
| Hot-humid | 25.15 | 7.4% | 5.0% | 35.6% |
| Marine | 6.98 | 2.3% | 3.4% | 25.5% |
| Income | Households (millions) | Unable to use AC | Unable to use heating | Any insecurity |
|---|---|---|---|---|
| Less than $10,000 | 6.23 | 16.5% | 18.9% | 63.7% |
| $10,000 to $14,999 | 5.90 | 13.1% | 8.5% | 58.3% |
| $15,000 to $29,999 | 13.42 | 9.5% | 9.8% | 51.4% |
| $30,000 to $59,999 | 30.96 | 7.7% | 5.9% | 41.4% |
| $60,000 to $99,999 | 29.41 | 5.3% | 4.4% | 32.1% |
| $100,000 to $199,999 | 32.30 | 2.9% | 1.7% | 18.2% |
| $200,000 or more | 14.32 | 1.5% | 1.2% | 7.5% |
The income gradient is the steepest in the data. 64% of households earning under $10,000 reported some form of energy insecurity in 2024, against 7.5% in the top band shown.
In the 2020 microdata the same gradient appears on the cooling measure specifically: 9.6% of households earning under $25,000 lost the use of air conditioning, against 1.4% of those earning $150,000 or more.
Frequently asked questions
How many US households could not use their air conditioning?
8.16 million in 2024, 6.2% of US households. EIA counts a household here if it could not use its air-conditioning equipment at any point in the previous 12 months because the equipment was broken and could not be repaired, or because electricity was disconnected for non-payment.
How many could not use their heating?
6.83 million in 2024, 5.2% of households, on the same definition extended to electricity, natural gas and bulk fuel disruptions.
Is that getting worse?
Yes on both measures. In 2020 the comparable figures were 6.35 million for air conditioning and 4.93 million for heating. Air conditioning rose 29% and heating rose 39%. EIA’s definitions for these two measures are the same across both cycles.
What is household energy insecurity?
EIA’s term for a set of hardships it asks about directly: reducing or forgoing food or medicine to pay an energy bill, leaving the home at an unhealthy temperature, receiving a disconnect or delivery-stop notice, and being unable to use heating or air-conditioning equipment. 43.56 million households, 32.9%, reported at least one in 2024.
How many households went without food or medicine to pay an energy bill?
32.89 million in 2024, 24.8% of US households. That is the single largest component of the measure and it was 24.61 million in 2020.
How long do households go without working equipment?
EIA has not published that for 2024, but the 2020 microdata carries it. Among the households that lost the use of heating, the mean was 38 days and the median 5. For air conditioning the mean was 38 days and the median 10. The gap between mean and median says a minority go without for a very long time.
Does anyone need medical attention from this?
In 2020, 0.97 million households reported someone needing medical attention because the home was too cold and 0.66 million because it was too hot. EIA has not published equivalent 2024 figures yet.
Which households are most affected?
Income is the strongest split in the published table. Among households earning under $10,000 a year, 64% reported some form of energy insecurity in 2024.
Where is it worst?
By census region the South reports the highest rate, and by climate region the hot-humid and mixed-dry/hot-dry regions do. Both patterns point the same way: cooling-dominated places where the equipment at risk is air conditioning.
When will the full 2024 data be available?
EIA published these preliminary housing characteristics tables ahead of the full release. Air conditioning, space heating and water heating detail from the 2024 cycle, along with the public use microdata, are scheduled for spring 2027.
Methodology and limitations
- 2024 figures: EIA Residential Energy Consumption Survey 2024, preliminary housing characteristics, Table HC11.1, Household energy insecurity, from Form EIA-457A. Base is 132.54 million primary occupied housing units in the 50 states and the District of Columbia; vacant units, seasonal units, second homes, military housing and group quarters are excluded.
- 2020 figures: computed here from the RECS 2020 public use microdata v7, weighted with the final analysis weight NWEIGHT, with standard errors from EIA’s documented Jackknife method using the 60 replicate weights.
- Comparability: EIA defines inability to use heating or cooling equipment as inability at any time in the previous 12 months because equipment was broken and could not be repaired, or because of a fuel or electricity disruption for non-payment. The 2020 equivalents are constructed from that definition. The “unhealthy temperature” measures are NOT compared, because the 2020 question asks about keeping the home at an unhealthy temperature and the 2024 table reports leaving it.
- The 2020 cycle was fielded during the first pandemic year, when utility disconnect moratoria were widespread. Comparisons involving disconnect notices should be read with that in mind.
- EIA’s energy insecurity measure covers only the hardships the questionnaire asks about. It is not an energy-burden measure and does not incorporate energy cost as a share of income.
- Suppression: EIA withholds cells where the relative standard error exceeds 50% or fewer than 10 households are in the reporting sample, marking them Q. Those cells are omitted here rather than shown as zero.
- Respondents may report more than one form of insecurity, so components do not sum to the any-insecurity total.
- No state-level figures are published. The 2024 preliminary release does not include state breakdowns, and EIA cautions that the RECS sample was not designed to estimate every variable at state level.
- Air conditioning, space heating and water heating detail from the 2024 cycle, and the 2024 public use microdata, are scheduled for release in spring 2027. This page will be revisited then.
- These are self-reported survey responses, not utility or service records.
Sources
- US Energy Information Administration, Residential Energy Consumption Survey 2024 preliminary housing characteristics, Table HC11.1, Household energy insecurity.
- US Energy Information Administration, RECS 2020 public use microdata, variables NOHEATBROKE, NOHEATEL, NOHEATNG, NOHEATBULK, NOACBROKE, NOACEL, NOHEATDAYS, NOACDAYS, SCALEB, SCALEE, COLDMA and HOTMA.
- US Energy Information Administration, Using the Microdata File to Compute Estimates and Standard Errors, June 2023.
The HVAC Brief is an independent trade publication. We do not sell equipment, take manufacturer advertising, or accept payment for placement in our research. Corrections welcome.
Leave a Reply