Last reviewed: September 2026 · By the HVAC Brief Editorial Team · Our sourcing and editorial standards
88.7% of American households use air conditioning, but the range across states runs from 97% in Iowa to 52% in Washington, the lowest of the contiguous states.
Heat pump heating varies even more: 42% of heated homes in South Carolina against 2% in Illinois. A 99.5% figure for Florida that circulates widely does not match EIA’s own published table.
EIA publishes state air conditioning figures as a PDF table. This page rebuilds them from the RECS 2020 microdata, extends them to heat pump heating and window-unit reliance, publishes the full state table, and checks every figure against EIA’s own release.
The national picture
| Measure | Share | Homes (millions) |
|---|---|---|
| Uses any air conditioning | 88.7% | 109.51 |
| Main cooling is central air (includes central heat pumps) | 66.9% | 82.69 |
| Main cooling is window or wall units | 17.3% | 21.43 |
| Main heating is a heat pump (central or ductless) | 13.9% | 17.19 |
Air conditioning by state
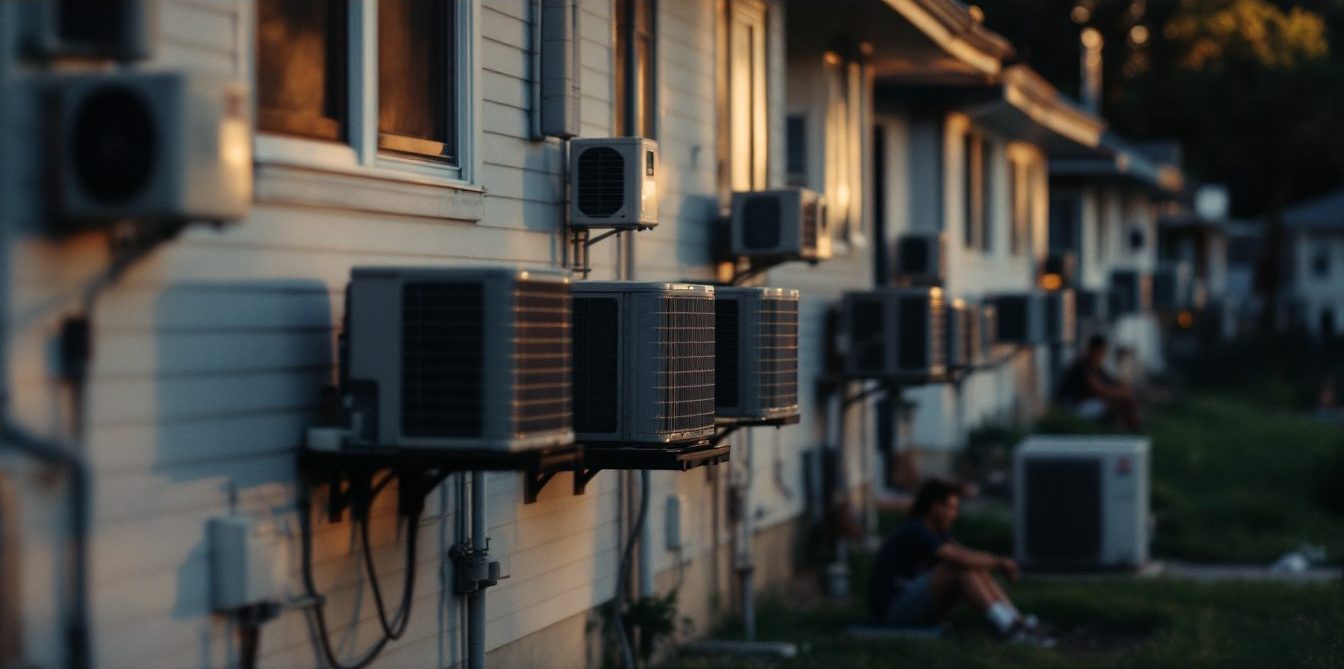
Air conditioning is close to universal across most of the country and absent across a narrow band of it. 33 states and the District of Columbia sit at 90% or above. The low end is the Pacific Northwest, northern New England, the northern Rockies, and the two non-contiguous states.
| State | Uses air conditioning |
|---|---|
| Alaska | 6.9% |
| Washington | 52.5% |
| Hawaii | 57.0% |
| Montana | 65.1% |
| Vermont | 67.0% |
| Maine | 70.4% |
| Wyoming | 70.7% |
| California | 72.4% |
Washington’s 52.5% is the figure to note. It means close to half the households in a state of nearly eight million people have no cooling at all, in a region where summer heat has been rising. Our cooling degree day index records summer 2026 running well above normal there.
The window-unit Northeast
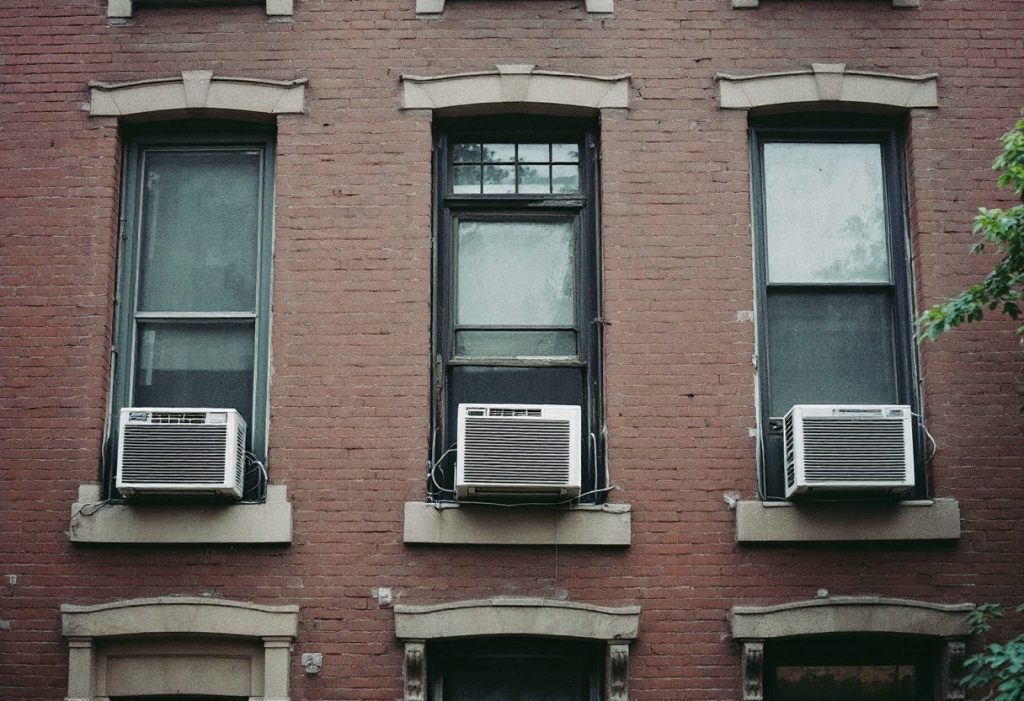
Having air conditioning and having central air are different things, and the Northeast shows the gap most clearly. In Rhode Island, 52% of households rely mainly on window or wall units, and New York and Connecticut are close behind. Older housing built without ducts is the reason, and it is also why ductless heat pumps are pitched hardest in those states.
| State | Main cooling is window or wall units |
|---|---|
| Rhode Island | 52.0% |
| New York | 50.4% |
| Connecticut | 49.1% |
| Vermont | 45.1% |
| Massachusetts | 43.8% |
| Maine | 43.4% |
| New Hampshire | 41.6% |
| New Jersey | 32.2% |
Heat pumps by state
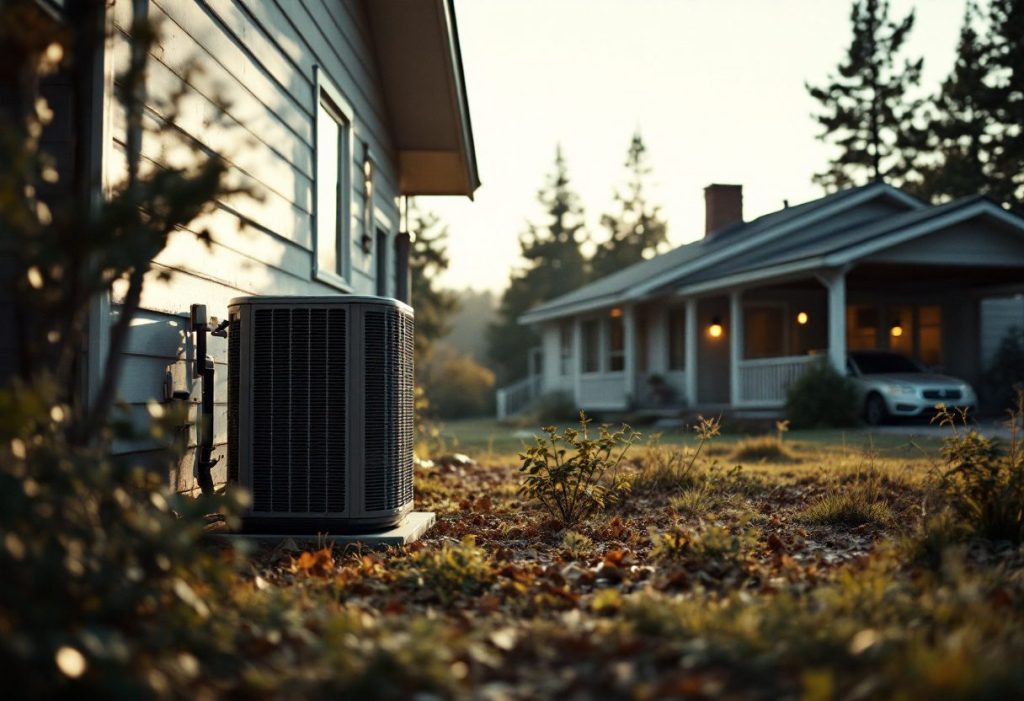
Heat pump heating is a regional technology. The top states are all in the Southeast, where mild winters made heat pumps the default electric heating long before federal electrification incentives.
| State | Heated homes using a heat pump |
|---|---|
| South Carolina | 41.7% |
| Alabama | 39.2% |
| North Carolina | 38.7% |
| Tennessee | 35.5% |
| Florida | 32.4% |
| Mississippi | 29.6% |
| Virginia | 28.7% |
| Georgia | 27.3% |
| State | Heated homes using a heat pump |
|---|---|
| Illinois | 2.4% |
| New Jersey | 2.9% |
| Massachusetts | 3.7% |
| New York | 4.2% |
| California | 4.2% |
| Iowa | 4.6% |
The spread from South Carolina at 41.7% to Illinois at 2.4% is about seventeenfold. Cold-climate heat pumps change that calculus, and shipment data shows heat pumps taking share since 2020, so these 2020 figures are a baseline rather than the current position.
Checking the numbers against EIA
Every state air conditioning figure here was compared with EIA’s own published State Air Conditioning table. They agree to within 0.5 percentage points in all 51 jurisdictions, with a mean difference of 0.24 points, which is EIA rounding to whole percentages.
That check matters because a different number is in circulation. Several sites state that 99.5% of homes in Florida, Oklahoma and Delaware have air conditioning. EIA’s table gives 96%, 96% and 97%. The 99.5% figure does not appear in EIA’s release and its origin could not be traced.
Every state
| State | Any AC | Central AC | Window or wall | Heat pump heating |
|---|---|---|---|---|
| Alabama | 93.5% | 80.1% | 13.4% | 39.2% |
| Alaska | 6.9% | – | – | – |
| Arizona | 94.2% | 84.7% | 5.4% | 26.4% |
| Arkansas | 93.4% | 72.3% | 19.4% | 19.7% |
| California | 72.4% | 52.9% | 12.8% | 4.2% |
| Colorado | 81.7% | 56.6% | 12.4% | – |
| Connecticut | 89.6% | 33.7% | 49.1% | – |
| Delaware | 97.0% | 84.4% | 10.9% | 21.6% |
| District of Columbia | 93.3% | 68.0% | 21.9% | 15.0% |
| Florida | 95.8% | 90.2% | 4.1% | 32.4% |
| Georgia | 95.2% | 85.3% | 9.1% | 27.3% |
| Hawaii | 57.0% | 11.3% | 28.5% | – |
| Idaho | 80.6% | 63.1% | 14.7% | – |
| Illinois | 96.0% | 73.5% | 20.9% | 2.4% |
| Indiana | 94.3% | 80.5% | 13.6% | 6.8% |
| Iowa | 97.2% | 81.1% | 14.5% | 4.6% |
| Kansas | 93.2% | 85.1% | 8.1% | 6.0% |
| Kentucky | 94.9% | 83.5% | 10.3% | 22.9% |
| Louisiana | 92.6% | 74.9% | 16.5% | 21.1% |
| Maine | 70.4% | 9.2% | 43.4% | – |
| Maryland | 91.4% | 79.4% | 8.7% | 19.7% |
| Massachusetts | 87.2% | 31.9% | 43.8% | 3.7% |
| Michigan | 86.6% | 66.2% | 17.1% | – |
| Minnesota | 94.3% | 68.1% | 21.8% | – |
| Mississippi | 92.9% | 77.5% | 13.2% | 29.6% |
| Missouri | 95.2% | 82.6% | 10.6% | 10.5% |
| Montana | 65.1% | 38.5% | 18.0% | – |
| Nebraska | 94.7% | 85.6% | 9.1% | 6.4% |
| Nevada | 92.0% | 77.2% | 6.5% | 7.6% |
| New Hampshire | 77.7% | 21.1% | 41.6% | – |
| New Jersey | 96.5% | 60.7% | 32.2% | 2.9% |
| New Mexico | 85.0% | 53.0% | – | – |
| New York | 87.7% | 28.6% | 50.4% | 4.2% |
| North Carolina | 90.6% | 84.2% | 5.4% | 38.7% |
| North Dakota | 92.9% | 58.1% | 32.0% | – |
| Ohio | 93.5% | 73.7% | 18.3% | 5.7% |
| Oklahoma | 96.0% | 83.2% | 12.8% | 12.2% |
| Oregon | 76.3% | 48.5% | 14.4% | 14.6% |
| Pennsylvania | 90.8% | 53.0% | 31.0% | 8.4% |
| Rhode Island | 90.0% | 30.7% | 52.0% | – |
| South Carolina | 95.1% | 86.4% | 7.6% | 41.7% |
| South Dakota | 92.0% | 76.4% | 14.6% | 4.8% |
| Tennessee | 93.5% | 85.5% | 7.6% | 35.5% |
| Texas | 95.0% | 82.8% | 10.1% | 19.8% |
| Utah | 91.9% | 79.2% | – | – |
| Vermont | 67.0% | 7.0% | 45.1% | – |
| Virginia | 94.6% | 82.5% | 10.1% | 28.7% |
| Washington | 52.5% | 29.3% | 10.8% | 13.1% |
| West Virginia | 89.1% | 63.0% | 25.1% | 20.2% |
| Wisconsin | 92.4% | 67.2% | 22.6% | – |
| Wyoming | 70.7% | 39.4% | 15.8% | – |
A dash marks a cell withheld under EIA’s reliability standard.
Frequently asked questions
What percentage of US homes have air conditioning?
88.7% of US households, 109.51 million homes, used air conditioning in 2020, according to EIA’s Residential Energy Consumption Survey. 66.9% used central air and 17.3% relied mainly on window or wall units.
Which state has the most air conditioning?
Iowa at 97.2%, followed by Delaware at 97.0% and New Jersey at 96.5%. Several Southern and Midwestern states sit within a point or two of each other at the top.
Which state has the least air conditioning?
Alaska at 6.9%. Among the contiguous states, Washington is lowest at 52.5%, meaning nearly half its households have no air conditioning.
Is it true that 99.5% of homes in Florida have air conditioning?
No. That figure circulates widely but does not match EIA’s published state table, which puts Florida, Oklahoma and Delaware at 96%, 96% and 97%. Our own calculation from the microdata agrees with EIA to within half a percentage point in every state.
How many US homes heat with a heat pump?
13.9% of households that heat their home, 17.19 million, use a central or ductless heat pump as their main heating equipment.
Which states use heat pumps most?
South Carolina (41.7%), Alabama (39.2%) and North Carolina (38.7%). Heat pumps dominate in the mild-winter Southeast, where they were the standard electric heating choice long before current electrification policy.
Which states use heat pumps least?
Illinois (2.4%), New Jersey (2.9%) and Massachusetts (3.7%) are lowest among states with a publishable estimate, about one seventeenth of the top rate.
Why are some states missing heat pump figures?
Because there are too few sampled heat pump households to estimate reliably. EIA advises against publishing any estimate with a relative standard error above 50 or fewer than 10 sampled households, and 17 states fail that test for heat pump heating. Those cells are shown as a dash rather than an unreliable number.
Is this data current?
It is the most recent available. It comes from RECS 2020. EIA’s 2024 survey has published preliminary tables, but its air conditioning and space heating detail is scheduled for spring 2027. Heat pump shipments have grown since 2020, so the heat pump shares here are likely below today’s level.
Methodology and limitations
- Source: EIA Residential Energy Consumption Survey 2020 public use microdata v7, weighted with the final analysis weight NWEIGHT.
- Measures: any air conditioning is AIRCOND = 1; central and window or wall are the main cooling equipment type (ACEQUIPM_PUB 1 and 4); heat pump heating is main space heating equipment of central heat pump or ductless heat pump (EQUIPM 4 and 13) among households using space heating.
- EIA codes central heat pumps within central air conditioning for cooling (ACEQUIPM_PUB 1 is ‘Central air conditioner (includes central heat pump)’), so heat pump cooling is not separable from central air in the cooling columns.
- State estimates: RECS 2020 was designed to support estimates for all 50 states and DC, but EIA cautions that not every variable is reliable at state level. Every cell is tested against EIA’s standard, a relative standard error at or below 50 and at least 10 sampled households, using EIA’s Jackknife method with 60 replicate weights. Failing cells are withheld.
- Ductless mini split penetration is not reported by state: it fails the reliability standard in 40 of 51 jurisdictions.
- Cross-check: state air conditioning shares agree with EIA’s published State Air Conditioning table to within 0.5 percentage points in every state.
- Vintage: collected in 2020. The 2024 RECS air conditioning and space heating detail is scheduled for spring 2027. Heat pump adoption has grown since 2020.
Sources
- US Energy Information Administration, RECS 2020 public use microdata.
- US Energy Information Administration, RECS 2020 state data, State Air Conditioning table, used for the cross-check.
- US Energy Information Administration, Using the Microdata File to Compute Estimates and Standard Errors.
The HVAC Brief is an independent trade publication. We do not sell equipment, take manufacturer advertising, or accept payment for placement in our research. Corrections welcome.
Leave a Reply