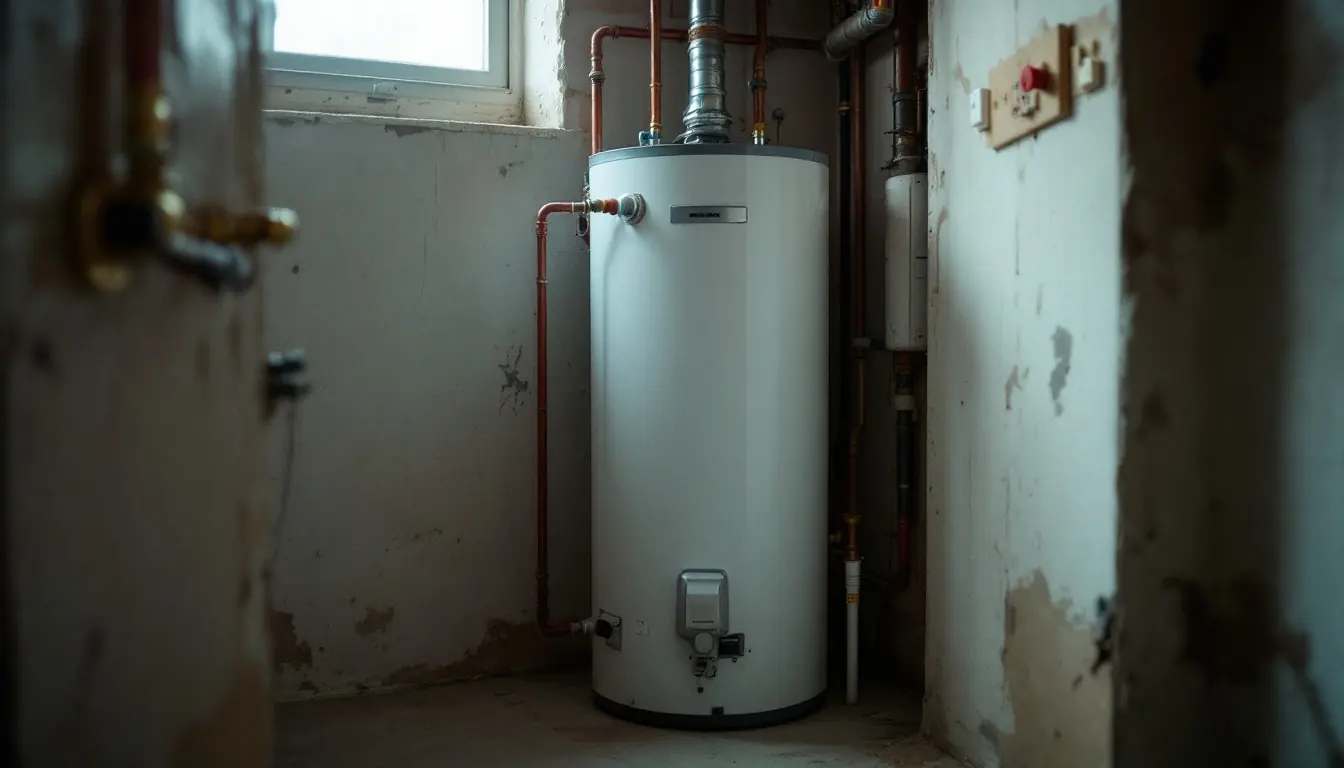
Every occupied US home has a water heater. This report counts them, using the Energy Information Administration’s Residential Energy Consumption Survey (RECS) 2020 microdata, the latest edition: 18,496 households representing 123.53 million homes. It measures fuel, size, age and running cost nationally and in every state, and uses the Census Bureau’s American Housing Survey (AHS) 2023 for replacement costs.
Last reviewed: November 2026 · By the HVAC Brief Editorial Team · Our sourcing and editorial standards
The short version: gas and electricity split the country almost evenly, 48.0% against 46.2%; 19.33 million households run a water heater that is at least 15 years old; and the average household spent $286 on water heating in 2020, 18.3 percent of all the energy it used at home.
Executive summary
Natural gas is the main water heating fuel in 59.33 million US homes (48.0%) and electricity in 57.04 million (46.2%). Propane (3.3%) and fuel oil (2.1%) make up almost all the rest. Electricity heats water in 88% of Florida homes and 15% of Utah homes.
Storage tanks dominate: 45% of homes have a 31 to 49 gallon tank and 38% one of 50 gallons or more. Tankless units are the main water heater in 8.03 million homes, 6.5%, but in 18% of homes built from 2016 to 2020.
The stock is old. 36% of water heaters, 44.43 million, were at least 10 years old in 2020, and 15.7%, 19.33 million, were at least 15. That includes 7.3% reported as 20 years or older. Those units are at or past the 10 to 15 year life DOE gives storage tanks.
Water heating cost the average household $286 in 2020: $341 with an electric heater and $224 with gas. Household size moves the bill more than fuel: $184 for one person, $434 for five or more. Replacing the heater cost homeowners who hired the job out a median of $1,400 in the AHS 2023, about 5 years of the average water heating bill.
Key findings
- Main water heating fuel: natural gas 48.0% (59.33 million homes), electricity 46.2% (57.04 million), propane 3.3%, fuel oil 2.1% (EIA RECS 2020, HVAC Brief analysis).
- 19.33 million water heaters (15.7%) were 15 or more years old; 44.43 million (36.0%) were 10 or more.
- Tankless water heaters: 6.5% of homes overall, 18.0% of homes built 2016 to 2020, and 23.7% of propane water heaters.
- Average annual water heating cost: $286 per household, 15.2 percent of the home energy bill and 18.3 percent of home energy use (2020).
- Most electric state: Florida, 88%. Least: Utah, 15%, then California (19%).
- Fuel oil still heats water in 34% of Maine homes and about a fifth of homes in Vermont, New Hampshire and Connecticut.
- Median hired water heater replacement: $1,400, middle half $900 to $2,000 (AHS 2023, projects 2021 to 2023).
Which fuel heats America’s water
In 2020 the answer was almost a tie. National standard errors are about 0.37 percentage points, so gas’s lead of 1.9 points is real but narrow. Our microdata totals reproduce EIA’s published table HC8.1: 59.33 million gas, 57.04 million electric and 8.03 million tankless homes.
| Fuel | Homes | Share | Std. error (pts) |
|---|---|---|---|
| Natural gas | 59.33 million | 48.03% | 0.36 |
| Electricity | 57.04 million | 46.18% | 0.37 |
| Propane | 4.12 million | 3.34% | 0.15 |
| Fuel oil | 2.62 million | 2.12% | 0.11 |
| Solar thermal | 0.23 million | 0.18% | 0.03 |
| Wood | 0.11 million | 0.09% | 0.02 |
| Other | 0.07 million | 0.05% | 0.02 |
Gas is the main space heating fuel in 62.71 million homes, 3.4 million more than use it for water (how American homes are heated). 4.7% of homes have more than one water heater.
By Building America climate zone, electricity heats water in 71 percent of hot-humid homes, 34 percent of cold-zone homes and 27 percent of hot-dry homes, so heat alone does not decide the fuel.
Water heater fuel by state
RECS 2020 is the first edition designed for estimates in every state. Samples range from 143 to 1,152 households, so state shares carry standard errors of roughly 1 to 4.5 percentage points. An asterisk marks states with fewer than 200 sample households. Costs are 2020 household averages in 2020 dollars.
| State | Electric | Gas | Propane | Fuel oil | Tankless | 15+ yrs old | Avg cost |
|---|---|---|---|---|---|---|---|
| Florida | 87.9% | 10.3% | 1.5% | 0.0% | 5.9% | 10.1% | $271 |
| South Carolina | 77.3% | 20.5% | 2.1% | 0.0% | 8.4% | 14.3% | $334 |
| North Carolina | 74.7% | 22.4% | 2.7% | 0.0% | 6.2% | 17.3% | $310 |
| Tennessee | 74.2% | 23.9% | 1.9% | 0.0% | 5.0% | 11.0% | $297 |
| Alabama | 71.9% | 25.7% | 2.4% | 0.0% | 3.8% | 9.3% | $340 |
| West Virginia* | 71.2% | 28.3% | 0.5% | 0.0% | 1.0% | 12.8% | $333 |
| Hawaii | 66.3% | 10.6% | 5.2% | 0.0% | 4.2% | 16.4% | $482 |
| Kentucky | 65.1% | 33.2% | 1.6% | 0.0% | 3.5% | 10.5% | $289 |
| Mississippi* | 64.9% | 28.5% | 6.6% | 0.0% | 5.8% | 24.1% | $296 |
| Oregon | 64.8% | 32.9% | 2.2% | 0.0% | 3.9% | 25.4% | $366 |
| Virginia | 63.0% | 32.5% | 3.9% | 0.7% | 6.1% | 19.3% | $349 |
| Washington | 62.5% | 34.5% | 2.8% | 0.0% | 6.8% | 22.6% | $310 |
| Louisiana | 60.6% | 36.7% | 2.6% | 0.0% | 4.5% | 16.9% | $275 |
| Georgia | 59.5% | 37.5% | 2.9% | 0.0% | 5.0% | 15.4% | $368 |
| Arkansas | 59.4% | 36.9% | 3.7% | 0.0% | 4.5% | 12.7% | $306 |
| North Dakota | 58.2% | 35.8% | 5.4% | 0.2% | 4.9% | 22.7% | $241 |
| Maryland | 56.9% | 38.6% | 2.0% | 1.4% | 7.1% | 22.2% | $301 |
| Delaware* | 56.9% | 29.1% | 10.2% | 3.9% | 12.5% | 12.8% | $330 |
| Arizona | 55.4% | 40.4% | 3.1% | 0.4% | 6.9% | 11.6% | $276 |
| Texas | 54.2% | 42.5% | 3.1% | 0.2% | 5.5% | 13.1% | $262 |
| District of Columbia | 52.4% | 46.4% | 0.2% | 0.9% | 4.6% | 29.6% | $229 |
| South Dakota* | 47.9% | 45.8% | 6.3% | 0.0% | 7.8% | 15.3% | $245 |
| Missouri | 46.9% | 50.2% | 2.8% | 0.0% | 5.4% | 16.8% | $250 |
| Idaho | 46.7% | 50.4% | 2.9% | 0.0% | 4.4% | 16.6% | $268 |
| Oklahoma | 45.4% | 49.9% | 4.8% | 0.0% | 4.1% | 9.6% | $251 |
| Pennsylvania | 44.5% | 45.9% | 3.2% | 5.7% | 5.7% | 14.1% | $295 |
| Indiana | 43.3% | 51.8% | 3.6% | 0.7% | 4.4% | 11.2% | $289 |
| Montana* | 41.3% | 51.9% | 5.0% | 1.1% | 10.0% | 19.1% | $246 |
| Wisconsin | 39.5% | 57.2% | 2.7% | 0.1% | 3.1% | 16.0% | $215 |
| New Hampshire* | 37.9% | 22.3% | 17.1% | 22.1% | 17.5% | 20.5% | $383 |
| Ohio | 37.6% | 57.2% | 4.8% | 0.4% | 3.8% | 14.0% | $236 |
| Minnesota | 37.3% | 59.4% | 3.0% | 0.0% | 7.0% | 20.4% | $242 |
| Connecticut | 36.8% | 37.7% | 3.5% | 21.5% | 12.4% | 15.2% | $383 |
| Vermont | 35.8% | 21.2% | 19.7% | 22.5% | 11.7% | 29.8% | $398 |
| Maine | 35.3% | 13.8% | 14.3% | 33.7% | 21.8% | 27.2% | $334 |
| Wyoming* | 33.3% | 62.2% | 4.5% | 0.0% | 9.7% | 12.0% | $238 |
| Nebraska* | 33.3% | 64.5% | 2.2% | 0.0% | 3.1% | 24.0% | $197 |
| Iowa | 32.6% | 58.5% | 8.6% | 0.0% | 5.5% | 21.2% | $196 |
| Kansas | 31.8% | 60.9% | 7.3% | 0.0% | 3.6% | 10.1% | $244 |
| Massachusetts | 29.7% | 52.4% | 2.3% | 15.1% | 15.3% | 14.2% | $336 |
| Alaska | 28.4% | 52.4% | 3.4% | 14.2% | 14.5% | 28.4% | $478 |
| Illinois | 28.1% | 69.2% | 2.6% | 0.0% | 3.3% | 12.3% | $190 |
| New York | 28.0% | 56.9% | 3.6% | 11.0% | 7.7% | 22.2% | $390 |
| Nevada | 27.4% | 67.4% | 5.2% | 0.0% | 6.5% | 14.4% | $241 |
| Michigan | 27.3% | 66.4% | 5.3% | 0.9% | 4.6% | 14.9% | $225 |
| Rhode Island* | 26.1% | 51.3% | 2.9% | 19.4% | 14.4% | 15.7% | $347 |
| New Jersey | 25.6% | 69.6% | 1.5% | 3.3% | 6.7% | 18.5% | $257 |
| Colorado | 22.0% | 73.3% | 3.4% | 0.4% | 6.4% | 11.1% | $173 |
| New Mexico* | 19.7% | 70.0% | 10.3% | 0.0% | 8.1% | 14.4% | $202 |
| California | 18.8% | 77.9% | 3.0% | 0.1% | 10.2% | 16.8% | $292 |
| Utah* | 15.4% | 82.7% | 1.9% | 0.0% | 3.8% | 12.9% | $221 |
Source: EIA RECS 2020 public microdata, HVAC Brief analysis. State standard errors 1 to 4.5 points.
The Southeast is the electric belt, led by Florida, South Carolina, North Carolina and Tennessee. Gas dominates in Utah, California, New Mexico and Colorado. Fuel oil still heats water in 34% of Maine homes and about a fifth in Vermont, New Hampshire and Connecticut.
Tank or tankless: water heater types and sizes
| Size or type | Homes | Share | Std. error (pts) |
|---|---|---|---|
| Small (30 gal or less) | 13.28 million | 10.8% | 0.27 |
| Medium (31-49 gal) | 55.37 million | 44.8% | 0.46 |
| Large (50 gal or more) | 46.85 million | 37.9% | 0.39 |
| Tankless | 8.03 million | 6.5% | 0.23 |
Tankless is still the exception, 6.5% of homes, but common in new construction: 18% of homes built from 2016 to 2020 have one, against 5% of 1980s homes. 24% of propane water heaters are tankless, against 6.6% of gas and 4.2% of electric units. How the technology works is in our tankless water heater guide.
The highest state tankless shares are in Maine (22%), New Hampshire (17%) and Massachusetts (15%), states with many oil and propane boilers. RECS does not separate a standalone on-demand heater from boiler-fed hot water, so part of that figure may be the latter.
Heat pump water heaters cannot be counted from RECS 2020, which records the fuel but not the technology. DOE’s 2024 rulemaking put them at about 3 percent of the electric storage market in 2023 (see our heat pump water heater guide).
In single-family homes the water heater sits in a basement (37%), the living space (30%), a garage (21%) or outside (9%).
How old are America’s water heaters?
Source: EIA RECS 2020 microdata. 21% of age responses were imputed by EIA.
| Age | Homes | Share | Std. error (pts) |
|---|---|---|---|
| Under 2 years | 17.65 million | 14.3% | 0.29 |
| 2-4 years | 22.49 million | 18.2% | 0.34 |
| 5-9 years | 38.96 million | 31.5% | 0.35 |
| 10-14 years | 25.10 million | 20.3% | 0.34 |
| 15-19 years | 10.35 million | 8.4% | 0.25 |
| 20+ years | 8.98 million | 7.3% | 0.22 |
| 10 years or older | 44.43 million | 36.0% | 0.42 |
| 15 years or older | 19.33 million | 15.7% | 0.33 |
The most common age is 5 to 9 years. 14% of homes had a unit under two years old, implying roughly 9 million installations a year in occupied homes around 2019 and 2020. 19.33 million homes ran a unit at least 15 years old, at or past DOE’s 10 to 15 year storage life. Old units are most common in Vermont (30% at 15 years or more), District of Columbia (30%) and Alaska (28%); least common in Alabama (9%).
What water heating costs, by fuel and household size
| Fuel | Avg cost | Std. error | Avg energy (million Btu) | Physical units |
|---|---|---|---|---|
| Electricity | $341 | $3 | 9.3 | 2,720 kWh |
| Natural gas | $224 | $2 | 18.2 | 181 hundred cubic feet |
| Propane | $392 | $9 | 17.0 | – |
| Fuel oil | $367 | $8 | 20.3 | – |
| All homes | $286 | $2 | 14.1 | – |
Gas homes use about twice the energy of electric homes, 18.2 against 9.3 million Btu, because a gas tank loses heat up the flue. They still pay less: water heating energy cost gas homes about $12 per million Btu against $37 for electric homes. Figures are EIA end-use estimates calibrated to bills, at 2020 prices; current prices are in the cost of heat by fuel.
Source: EIA RECS 2020 microdata, all fuels. HVAC Brief analysis.
The number of people in the home matters more than fuel. Cost rises from $184 for a single person to $263 for two, $398 for four and $434 for five or more, a ratio of 2.4 to 1, against 1.5 to 1 between electric and gas. Gas tankless homes averaged $179, the lowest of any gas type, but that is a comparison of different households, not a measured saving. Thermostat setting is another lever (water heater temperature guide).
By state, cost was highest in Hawaii ($482) and Alaska ($478) and lowest in Colorado ($173) and Illinois ($190), both gas-dominant.
Owners, renters and housing type
| Measure | Owners | Renters |
|---|---|---|
| Share of households | 67% | 32% |
| Electric main water heater | 42% | 55% |
| Gas main water heater | 51% | 42% |
| Tankless | 7.4% | 4.7% |
| Tank 30 gal or less | 7.7% | 17.3% |
| Tank 50 gal or more | 39.9% | 34.0% |
| Water heater serves several units | 2.7% | 37.3% |
| 10 or more years old | 35.3% | 37.3% |
| 15 or more years old | 15.6% | 15.6% |
| Average annual water heating cost | $287 | $284 |
Renters more often have electric heat, small tanks and shared systems. Age and average cost are the same for both groups within survey error. Mobile homes are the most electric housing type (76 percent).
What it costs to replace a water heater
RECS does not ask about prices; the AHS asks owners what each improvement in the prior two years cost. In 2023, owners of 86.9 million owner-occupied homes reported 7.86 million water heater additions or replacements, about 3.9 million a year, at a total of $11.96 billion (same file as our HVAC replacement cost report).
| Project | Projects | 10th pct | 25th pct | Median | 75th pct | 90th pct | Mean |
|---|---|---|---|---|---|---|---|
| All water heater projects | 7.86 million | $400 | $670 | $1,000 | $1,900 | $3,000 | $1,577 |
| Hired out | 5.15 million | $500 | $900 | $1,400 | $2,000 | $3,500 | $1,932 |
| Do it yourself | 2.71 million | $300 | $500 | $700 | $1,000 | $1,500 | $892 |
| Hired, electric water heating home | 1.71 million | $400 | $740 | $1,100 | $1,900 | $3,500 | $1,691 |
| Hired, piped gas water heating home | 3.20 million | $600 | $1,000 | $1,500 | $2,100 | $3,400 | $1,985 |
The hired-out median was $1,400, with half of jobs between $900 and $2,000 and one in ten at $3,500 or more. Homes with gas water heating paid a hired median of $1,500, against $1,100 for electric. Households did 34 percent of projects themselves, at a median of $700. 81 percent of water heater projects were paid from savings and 10 percent on a credit or store card.
Source: Census/HUD AHS 2023 project file, HVAC Brief analysis. Replicate standard errors on division medians are $85 to $169.
New England and the Pacific had the highest hired medians ($1,800), East South Central the lowest ($1,100); middle-division differences are within error. For sizing and the federal efficiency rules that change in 2029, see our water heater replacement guide; for manufacturer shipment trends, our water heater shipments report.
Original synthesis (HVAC Brief calculations)
1. The replacement pipeline: about 44 million tanks due within a decade
In 2020, 19.33 million homes had a water heater 15 or more years old and 25.10 million one aged 10 to 14. Against DOE’s 10 to 15 year storage life, that is about 44 million units due for replacement in roughly the decade after the survey. The AHS shows owner-occupied homes replacing about 3.9 million a year; rentals and new homes add to that. This is an HVAC Brief estimate, not a survey result.
2. Who the 2029 electric standard reaches
From May 6, 2029, most new electric storage heaters of 20 to 55 gallons must meet levels DOE says only heat pump technology achieves. That falls on 57.04 million electric water heating homes, including more than 70 percent of homes in Florida, South Carolina, North Carolina, Tennessee, Alabama and West Virginia. Renters are more exposed than owners (55% electric against 42%).
3. A replacement costs about five years of hot water
The hired median replacement ($1,400) is 4.9 times the average annual bill ($286); 7.6 times for one person and 3.2 for five or more. Efficiency upgrades pay back fastest in large households. The figures come from different surveys and years, so the ratio is indicative.
4. Tankless is a new-home technology, not a retrofit wave
Tankless shares range from 4.6 to 6.1 percent for homes built from the 1950s to the 2000s, then jump to 12% for 2010 to 2015 and 18% for 2016 to 2020. Owners of older homes mostly replace a tank with a tank.
Charts worth building from this data
- Choropleth map of electric water heating share by state.
- Age distribution of the water heater stock, owners versus renters.
- Scatter of state water heating cost against electric share.
- Tankless share by year built.
Most quotable statistics
- Natural gas heats water in 48.0% of US homes and electricity in 46.2% (EIA RECS 2020, HVAC Brief analysis).
- 19.33 million American homes were running a water heater at least 15 years old.
- The average US household spent $286 a year on water heating, 18 percent of its home energy use (2020).
- 88% of Florida homes heat water with electricity; in Utah, 15%.
- The median hired water heater replacement cost $1,400 (Census/HUD AHS 2023).
Data limitations
- RECS 2020 describes the 2020 stock; costs are in 2020 prices and ages have moved since.
- EIA imputed 21 percent of age, 25 percent of size and 15 percent of fuel responses; imputed values are included, as in EIA tables. Renters may not know a unit’s true age.
- RECS does not identify heat pump water heaters, and its tankless category may include boiler-fed hot water.
- Energy and cost are EIA end-use model estimates calibrated to bills, not metered.
- State samples are 143 to 1,152 households; state shares carry errors of 1.2 to 4.6 points.
- AHS costs cover owner-occupied homes only and are owner-reported. The AHS 2023 household file shows a different fuel split (electric 47.5%, gas 45.0%) from RECS 2020; different questions, years and samples mean this is not a trend.
Downloadable dataset: recommended fields
| Field | Description |
|---|---|
| state | State postal code |
| fuel_share_* | Share by main water heater fuel, with jackknife SE |
| tankless_share | Share with tankless main water heater |
| age_10plus / age_15plus | Share of units 10+ / 15+ years old |
| avg_cost_wth | Mean annual water heating cost, 2020 dollars |
| ahs_median_hired | AHS 2023 median hired replacement cost |
Press summary
Natural gas and electricity split US water heating almost evenly, 48.0% to 46.2%, but 19.33 million homes run a water heater at least 15 years old, according to an HVAC Brief analysis of federal RECS microdata. The average household spent $286 a year heating water; a hired replacement cost a median $1,400 (AHS 2023).
Suggested headlines
- 19.33 million US homes run a water heater past its expected life
- Florida heats water with electricity; Utah with gas
- Tankless water heaters are in 18% of new homes, but 6.5% overall
Source quality ranking
| Source | Tier | Why |
|---|---|---|
| EIA RECS 2020 public microdata v7 and table HC8.1 | Tier 1 | Federal survey with state estimates and replicate weights |
| Census/HUD American Housing Survey 2023 | Tier 1 | Owner-reported project costs with replicate weights |
| Retailer and contractor price guides | Excluded | Unknown samples |
Methodology
- RECS: 18,496 records weighted by NWEIGHT (123.53 million homes); FUELH2O, WHEATSIZ, WHEATAGE, H2OAPT, H2OMAIN, KOWNRENT, TYPEHUQ, BA_climate, YEARMADERANGE, NHSLDMEM, state_postal; TOTALDOLWTH, TOTALBTUWTH, KWHWTH, CUFEETNGWTH, TOTALDOL, TOTALBTU.
- Standard errors use replicate weights NWEIGHT1 to NWEIGHT60 and EIA’s jackknife formula: variance = (59/60) x sum of squared replicate deviations. Counts reproduce EIA table HC8.1.
- Share of energy use and bill are ratio estimates of weighted sums.
- AHS: 2023 project file, JOBTYPE 29, JOBDIY 1 or 2, joined to household WEIGHT, DIVISION, HOTWATER and 160 replicate weights (variance = 4/160 x sum of squares). Medians exclude zero-cost projects.
Frequently asked questions
What percentage of homes have electric water heaters?
46.2% of US homes, 57.04 million; 48.0% use natural gas (EIA RECS 2020).
How many water heaters are in the US?
All 123.53 million occupied homes had a main water heater in 2020, and 5.75 million had more than one.
How old is the average water heater?
The most common age band is 5 to 9 years. 36% are 10 or more years old and 15.7% are 15 or more.
How much does it cost to run a water heater per year?
$286 on average in 2020: $341 for electric and $224 for gas.
What share of home energy goes to water heating?
18.3 percent of household energy use and 15.2 percent of the bill (2020).
How many homes have tankless water heaters?
8.03 million, or 6.5%; 18% of homes built 2016 to 2020.
Which state uses the most electric water heaters?
Florida (88%). Utah has the lowest share (15%).
How much does it cost to replace a water heater?
The median hired project was $1,400, with half between $900 and $2,000 (AHS 2023).
How long do water heaters last?
DOE gives storage tanks 10 to 15 years and tankless units more than 20. 19.33 million homes had a unit 15 or more years old.
How many heat pump water heaters are there?
RECS 2020 does not identify them. DOE estimated them at about 3 percent of electric storage sales in 2023.
Cite this report
Sources
- US Energy Information Administration, 2020 Residential Energy Consumption Survey, public use microdata file v7 and codebook.
- EIA, Using the 2020 RECS Microdata File to Compute Estimates and Standard Errors.
- EIA RECS 2020 Table HC8.1, water heating in US homes.
- US Census Bureau and HUD, American Housing Survey 2023, National Public Use File, project and household files.
- 10 CFR 430.32(d), energy conservation standards for water heaters.
The HVAC Brief is an independent trade publication. We do not sell equipment, take manufacturer advertising, or accept payment for placement in our research. Corrections welcome.
Leave a Reply