Last reviewed: October 2026 · By the HVAC Brief Editorial Team · Our sourcing and editorial standards
This report brings together the two national estimates of home heating fires in the United States: the US Fire Administration’s (USFA) residential building heating fire estimates from the National Fire Incident Reporting System (NFIRS), which run through 2023, and the National Fire Protection Association’s (NFPA) home heating equipment fire analysis, which breaks fires down by equipment, dwelling, month and time of day. The two use different definitions and produce very different death counts; this report shows both and explains why. For carbon monoxide deaths, which are not fires, see our companion report on carbon monoxide deaths from heating equipment.
Heating fires have fallen by more than four-fifths since 1980. But fatal heating fires have fallen more slowly, and one type of equipment, the space heater, accounts for 88 percent of the deaths.
Executive summary
US fire departments responded to an estimated 44,210 home fires involving heating equipment a year in 2016 to 2020, according to NFPA, causing 480 civilian deaths, 1,370 injuries and $1,059 million in direct property damage a year. Heating equipment caused 13 percent of home structure fires and 18 percent of home fire deaths, making it the second-leading cause of home fires after cooking.
Space heaters, fixed or portable, were involved in 33 percent of heating fires but 88 percent of the deaths and 80 percent of the injuries. Central heating systems, including furnaces, accounted for 4 percent of fires and an estimated zero deaths. Confined chimney and fuel-burner fires, nearly half of all heating fires, caused almost no casualties.
USFA’s NFIRS-based estimates, which use a narrower cause definition, show 27,900 residential building heating fires and 115 deaths in 2023, the lowest fire count in the decade. Fires fell 41 percent and deaths 53 percent between 2014 and 2023 on that measure.
Over the long run, NFPA’s series shows heating fires falling from 230,000 in 1980 to 42,000 in 2020 (82 percent), while deaths fell from 1,000 to 400 (60 percent). Because fires fell faster than deaths, the death rate per heating fire roughly doubled, from 4.3 to 9.5 deaths per 1,000 fires (HVAC Brief calculation).
Key findings
- Home heating equipment fires: 44,210 a year, 2016 to 2020 average (NFPA).
- Deaths: 480 a year; injuries: 1,370; direct property damage: $1,059 million a year (NFPA).
- Heating equipment caused 13 percent of home fires and 18 percent of home fire deaths (NFPA).
- Space heaters: 33 percent of heating fires, 88 percent of deaths, 80 percent of injuries.
- Space heater fires killed 29 people per 1,000 fires; central heating fires, effectively none (HVAC Brief calculation from NFPA).
- December to February: 46 percent of heating fires and 52 percent of deaths.
- Midnight to 6 a.m.: 13 percent of heating fires but 43 percent of deaths (NFPA).
- Single-family homes: 45 percent of heating fires, 88 percent of deaths.
- USFA 2023: 27,900 residential building heating fires, 115 deaths, 525 injuries, $488 million in losses.
- USFA trend 2014 to 2023: fires down 41 percent, deaths down 53 percent.
- NFPA trend 1980 to 2020: fires down 82 percent, deaths down 60 percent.
- Deaths per 1,000 heating fires: 4.3 (1980), 7.7 (2003), 9.5 (2020) (HVAC Brief calculation).
How many home heating fires are there each year?
There are two answers, and both are official. NFPA estimates 44,210 home heating equipment fires a year (2016 to 2020 average); USFA estimates 27,900 residential building heating fires in 2023. The NFPA figure is larger because it counts fires where heating equipment was involved in ignition and proportionally allocates fires whose equipment was unknown, while USFA assigns each fire a single cause from a cause hierarchy. Both come from the same underlying fire department reports to NFIRS. For a count of fires, either is defensible if labelled; for deaths, the difference is large (see the synthesis below).
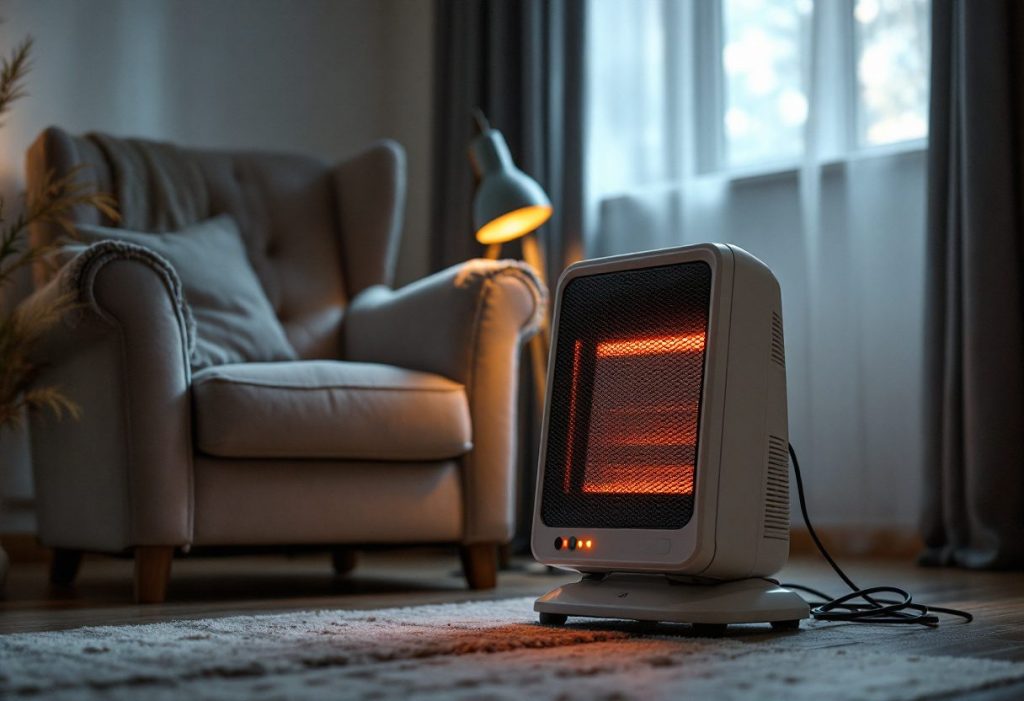
Heating fires by type of equipment
| Equipment | Fires | Share | Deaths | Share | Injuries | Damage | Deaths per 1,000 fires |
|---|---|---|---|---|---|---|---|
| Fixed or portable space heater | 14,600 | 33% | 420 | 88% | 1,100 | $584M | 28.8 |
| Confined chimney or flue fire | 13,120 | 30% | 0 | 0% | 20 | $5M | 0.0 |
| Confined fuel burner or boiler fire | 6,970 | 16% | 0 | 0% | 20 | $3M | 0.0 |
| Water heater | 3,160 | 7% | 20 | 4% | 90 | $83M | 6.3 |
| Fireplace or chimney (non-confined) | 3,010 | 7% | 30 | 6% | 50 | $234M | 10.0 |
| Central heat | 1,860 | 4% | 0 | 0% | 60 | $75M | 0.0 |
| Other known heating equipment | 1,490 | 3% | 20 | 4% | 30 | $76M | 13.4 |
| Total | 44,210 | 100% | 480 | 100% | 1,370 | $1,059M | 10.9 |
Source: NFPA, Home Heating Fires Supporting Tables (December 2022). HVAC Brief chart.
The table separates two very different kinds of fire. Confined fires, chimney or flue fires and fuel-burner or boiler fires that stay inside the appliance, make up 45 percent of heating fires and almost none of the harm. Non-confined fires, which spread beyond the equipment, account for all 480 deaths. Among those, space heaters dominate. A space heater fire in this period was about 3 times as likely to kill someone as a non-confined fireplace or chimney fire, and fireplaces and chimneys caused the second-largest property loss ($234 million a year), reflecting fires that spread into roof and wall cavities.
Central heat, the category that covers furnaces and central heating systems, was involved in 1,860 fires a year, 4 percent of the total, with an estimated zero civilian deaths and 60 injuries. That is the clearest evidence in the data that ducted central systems are not where the fire risk in home heating lies. Water heaters, often installed in garages and basements near stored combustibles, were involved in 3,160 fires.
The ten-year USFA trend
| Year | Fires | Deaths | Injuries | Dollar loss ($M) |
|---|---|---|---|---|
| 2014 | 47,600 | 245 | 850 | $777.7 |
| 2015 | 41,200 | 165 | 575 | $504.4 |
| 2016 | 35,100 | 165 | 500 | $439.1 |
| 2017 | 33,800 | 195 | 575 | $397.4 |
| 2018 | 35,700 | 155 | 575 | $497.9 |
| 2019 | 33,100 | 145 | 675 | $418.4 |
| 2020 | 33,000 | 125 | 575 | $445.7 |
| 2021 | 32,200 | 190 | 625 | $497.0 |
| 2022 | 34,800 | 110 | 650 | $587.8 |
| 2023 | 27,900 | 115 | 525 | $488.0 |
Source: US Fire Administration, Residential Building Heating Fire Trends (2014-2023).
USFA’s series shows heating fires falling from 47,600 in 2014 to 27,900 in 2023, with a bump in 2018 and 2022. Deaths fell from 245 to 115, though the series is volatile (190 in 2021). Dollar losses have not fallen in step: $488 million in 2023 compared with $778 million in 2014, in current dollars, which is a much smaller real decline once construction costs are counted.
The 40-year NFPA trend
| Year | Fires | Deaths | Deaths per 1,000 fires |
|---|---|---|---|
| 1980 | 230,000 | 1,000 | 4.3 |
| 1985 | 200,900 | 1,180 | 5.9 |
| 1990 | 97,500 | 800 | 8.2 |
| 1995 | 78,400 | 560 | 7.1 |
| 2000 | 72,500 | 810 | 11.2 |
| 2005 | 64,900 | 730 | 11.2 |
| 2010 | 57,100 | 490 | 8.6 |
| 2015 | 48,300 | 420 | 8.7 |
| 2020 | 42,000 | 400 | 9.5 |
Most of the decline came before 2000. Fires fell from about 230,000 a year in the early 1980s to under 100,000 by 1990, from a peak that coincided with the wood-burning boom after the 1970s energy crises. NFPA credits improved safety standards, such as automatic tip-over shut-offs on space heaters and guarding around heating elements, with influencing the decline. Since 2010 the count has drifted down from about 57,000 to 42,000.
When heating fires happen
Source: NFPA supporting tables, Table 4.
Heating fires follow the heating season. January alone accounts for 18 percent of fires and 21 percent of deaths, and December through February for 46 percent of fires and 52 percent of deaths. June through August still see about 4,000 heating equipment fires. By time of day, the evening hours from 5 to 9 p.m. have the most fires, but the overnight hours from midnight to 6 a.m., with 13 percent of fires, have 43 percent of deaths, because people are asleep.
Where heating fires happen
| Dwelling | Fires | Deaths | Injuries | Damage ($M) |
|---|---|---|---|---|
| Single-family, year-round | 20,020 | 420 | 830 | $787 |
| Two-family, year-round | 1,640 | 20 | 70 | $47 |
| One- or two-family, unclassified | 15,160 | 10 | 90 | $67 |
| Multifamily, all sizes | 7,390 | 20 | 400 | $158 |
Single-family homes account for 45 percent of heating fires and 88 percent of deaths. Apartments and other multifamily buildings, with 13 percent of fires, account for about 5 percent of deaths but nearly a fifth of injuries, which likely reflects sprinklers, fire separations and central building systems that limit fire spread but not smoke exposure. The one-or-two-family unclassified group is dominated by small confined fires.
Original synthesis (HVAC Brief calculations)
1. Why NFPA and USFA disagree by four times on deaths
NFPA’s estimate of 480 deaths a year (2016 to 2020) and USFA’s estimates of between 125 and 195 a year over the same years differ by roughly three to four times. Both draw on NFIRS. The documented differences are in definition and allocation: NFPA counts fires where heating equipment was the equipment involved in ignition, allocates fires with unknown equipment proportionally across known categories, and scales to its own national fire experience survey; USFA classifies each fire into a single cause using a hierarchy and reports residential buildings rather than homes. Fatal fires tend to be more severe and harder to investigate, so they are more likely to have an undetermined cause or equipment, and allocation rules move deaths more than fires. For journalists: cite NFPA when describing the scale of heating fire deaths, cite USFA for recent-year trends, and name the source either way.
2. The deadliest heating equipment, per fire
Deaths per 1,000 fires, calculated from NFPA’s equipment table, ranks the risk of each type when it does catch fire.
| Equipment | Deaths per 1,000 fires | Damage per fire |
|---|---|---|
| Fixed or portable space heater | 28.8 | $40,000 |
| Other known heating equipment | 13.4 | $51,007 |
| Fireplace or chimney (non-confined) | 10.0 | $77,741 |
| Water heater | 6.3 | $26,266 |
| Confined chimney or flue fire | 0.0 | $381 |
| Confined fuel burner or boiler fire | 0.0 | $430 |
| Central heat | 0.0 | $40,323 |
A space heater fire is the deadliest heating fire by a wide margin, at 28.8 deaths per 1,000. A fireplace or chimney fire that escapes the chimney is the most expensive, at about $77,741 per fire. Central heat fires are less expensive than both and have no estimated deaths. Space heaters are used as a supplement in tens of millions of homes; our secondary heating statistics report counts them.
3. Heating fires got rarer, but each one got deadlier
Between 1980 and 2020, NFPA’s estimate of home heating fires fell 82 percent and deaths fell 60 percent. Dividing one by the other, deaths per 1,000 heating fires rose from 4.3 in 1980 to 9.5 in 2020. Part of this is definitional: NFIRS version 5.0, adopted from 1999, changed how small confined fires are coded. But the rise continues after 2000, from 7.7 in 2003 to 9.5 in 2020 on a consistent basis. A plausible reading is that the fires that have been eliminated, small wood stove and chimney fires, were the least deadly, leaving a residual of space heater fires in occupied rooms, which kill. Prevention gains are now concentrated in a small number of high-risk situations.
4. The overnight risk
Overnight fires are rare and lethal. From midnight to 6 a.m., NFPA counts about 5,600 heating fires a year (13 percent) and about 200 deaths (about two in five). That is about 36 deaths per 1,000 overnight heating fires, against about 7 per 1,000 for fires the rest of the day (HVAC Brief calculation from Table 5). The practical implication is the one fire services give: space heaters off when sleeping, and working smoke alarms outside sleeping areas.
Charts worth building from this data
- Stacked bar of heating fires vs deaths by equipment type (share).
- Line chart of NFPA heating fires and deaths, 1980 to 2020, indexed to 1980.
- Heat map of heating fires by month and time of day.
- Dual-axis chart of USFA fires and deaths, 2014 to 2023.
- Bar chart of deaths per 1,000 fires by equipment.
Most quotable statistics
- US fire departments respond to about 44,210 home heating fires a year, which kill about 480 people (NFPA, 2016-2020 average).
- Space heaters are involved in a third of home heating fires but 88 percent of heating fire deaths (NFPA).
- Central heating systems are involved in 4 percent of home heating fires and an estimated zero deaths (NFPA).
- Heating fires that start between midnight and 6 a.m. are 13 percent of the total but 43 percent of the deaths (NFPA).
- Home heating fires fell 82 percent between 1980 and 2020, but deaths per fire roughly doubled (HVAC Brief calculation from NFPA).
- In 2023, USFA estimated 27,900 residential building heating fires, the fewest in a decade.
Data limitations
- NFPA and USFA estimates use different definitions and are not interchangeable; the death estimates differ by roughly four times.
- NFPA’s equipment detail is for 2016 to 2020 and was published in 2022; no more recent NFPA equipment breakdown was available at the time of writing.
- NFIRS participation is voluntary and incomplete. National estimates are scaled using NFPA’s fire department survey (NFPA) or USFA’s methodology.
- Fires reported only to state or federal agencies, or not reported at all, are excluded.
- Dollar losses are direct property damage in current dollars and exclude indirect costs.
- Death-per-fire ratios use rounded published estimates and are approximate.
Downloadable dataset: recommended fields
| Field | Description |
|---|---|
| source | NFPA or USFA |
| year_or_period | Year or averaging period |
| equipment_type | NFPA heating equipment category |
| fires | Estimated fires |
| civilian_deaths | Estimated deaths |
| civilian_injuries | Estimated injuries |
| direct_damage_musd | Direct property damage, million USD |
| month / hour | Month or hour of alarm |
| dwelling_type | Dwelling category |
| deaths_per_1000_fires | Calculated lethality |
Press summary
About 44,210 home heating fires a year kill around 480 Americans, and space heaters account for 88 percent of those deaths, according to an HVAC Brief compilation of National Fire Protection Association and US Fire Administration data. Central heating systems are involved in only 4 percent of heating fires and no estimated deaths. Heating fires have fallen more than 80 percent since 1980, but the death rate per fire has roughly doubled, and fires that start overnight are the deadliest.
Suggested headlines
- Space heaters cause 88% of home heating fire deaths
- Heating fires are rarer than ever, but deadlier per fire
- Furnaces are not the heating fire problem: zero estimated deaths
- Why two federal sources disagree four-fold on heating fire deaths
- The most dangerous hours for home heating fires are after midnight
Source quality ranking
| Source | Tier | Why |
|---|---|---|
| US Fire Administration national estimates (NFIRS) | Tier 1 | Federal agency; annual national estimates through 2023 |
| NFPA Home Heating Fires report and supporting tables | Tier 1 | Standards body using NFIRS plus its national fire experience survey; the most detailed breakdown |
| Manufacturer or insurer safety claims | Excluded | Not used |
Methodology
- USFA: Residential Building Heating Fire Trends (2014-2023), national estimates of fires, deaths, injuries and dollar loss, retrieved October 2026.
- NFPA: Home Heating Fires (2016-2020 annual averages) and Home Heating Fires Supporting Tables (December 2022), Tables 1 to 5.
- Deaths per 1,000 fires = published deaths / published fires x 1,000; damage per fire similarly. Overnight figures sum the six hourly rows from midnight to 5:59 a.m.
- Selected years in the 40-year table are taken from NFPA Table 3; values for 1999 to 2001 are flagged by NFPA as uncertain and are not shown.
- No figures in this report are modelled by The HVAC Brief beyond the stated ratios.
Frequently asked questions
How many house fires are caused by heating each year?
NFPA estimates 44,210 home fires a year involving heating equipment (2016 to 2020 average). USFA estimates 27,900 residential building heating fires in 2023, using a narrower definition.
How many people die in heating fires each year?
About 480 a year on NFPA’s estimate (2016 to 2020). USFA’s narrower estimate was 115 in 2023.
What is the most common cause of heating fires?
By count, space heaters (14,600 a year) and confined chimney or flue fires (13,120). By deaths, space heaters, with 88 percent.
Do furnaces cause house fires?
Rarely, and seldom fatally. Central heat was involved in 1,860 fires a year, 4 percent of heating fires, with an estimated zero deaths in 2016 to 2020.
Are space heaters dangerous?
They are the deadliest heating equipment when they catch fire: about 29 deaths per 1,000 fires, and 88 percent of heating fire deaths.
When do most heating fires happen?
December through February, with 46 percent of fires; January is the peak month. By time of day, 5 to 9 p.m. has the most fires, and midnight to 6 a.m. the most deaths.
Are heating fires decreasing?
Yes. NFPA’s estimate fell from 230,000 in 1980 to 42,000 in 2020; USFA’s fell 41 percent from 2014 to 2023.
Why do NFPA and USFA heating fire numbers differ?
They use different definitions (equipment involved versus cause hierarchy), NFPA allocates fires with unknown equipment, and they cover homes versus residential buildings.
How much property damage do heating fires cause?
About $1,059 million a year in direct damage (NFPA, 2016 to 2020); USFA estimated $488 million in 2023.
Can a chimney fire burn down a house?
Most chimney fires stay confined (13,120 a year, almost no casualties), but the 3,010 non-confined fireplace and chimney fires cause $234 million in damage a year, 22 percent of all heating fire damage.
Cite this report
Sources
- US Fire Administration, Residential Building Heating Fire Trends (2014-2023).
- National Fire Protection Association, Home Heating Fires, 2016-2020 annual averages.
- NFPA, Home Heating Fires Supporting Tables, December 2022.
- USFA, Methodology for national estimates of residential building fires.
The HVAC Brief is an independent trade publication. We do not sell equipment, take manufacturer advertising, or accept payment for placement in our research. Corrections welcome.
Leave a Reply