Original data and independent reporting for the HVAC trade

Category: Equipment

Heat pumps, furnaces, air conditioners, efficiency standards and brand data.

  • How Often Should HVAC Be Serviced? What Is Established

    How Often Should HVAC Be Serviced? What Is Established

    Last reviewed: August 2026 · By the HVAC Brief Editorial Team · Our sourcing and editorial standards

    The short answer

    The common advice is annual servicing, once for cooling and once for heating on a system that does both, but no federal agency sets or measures a required interval. It is manufacturer and trade guidance, not regulation.

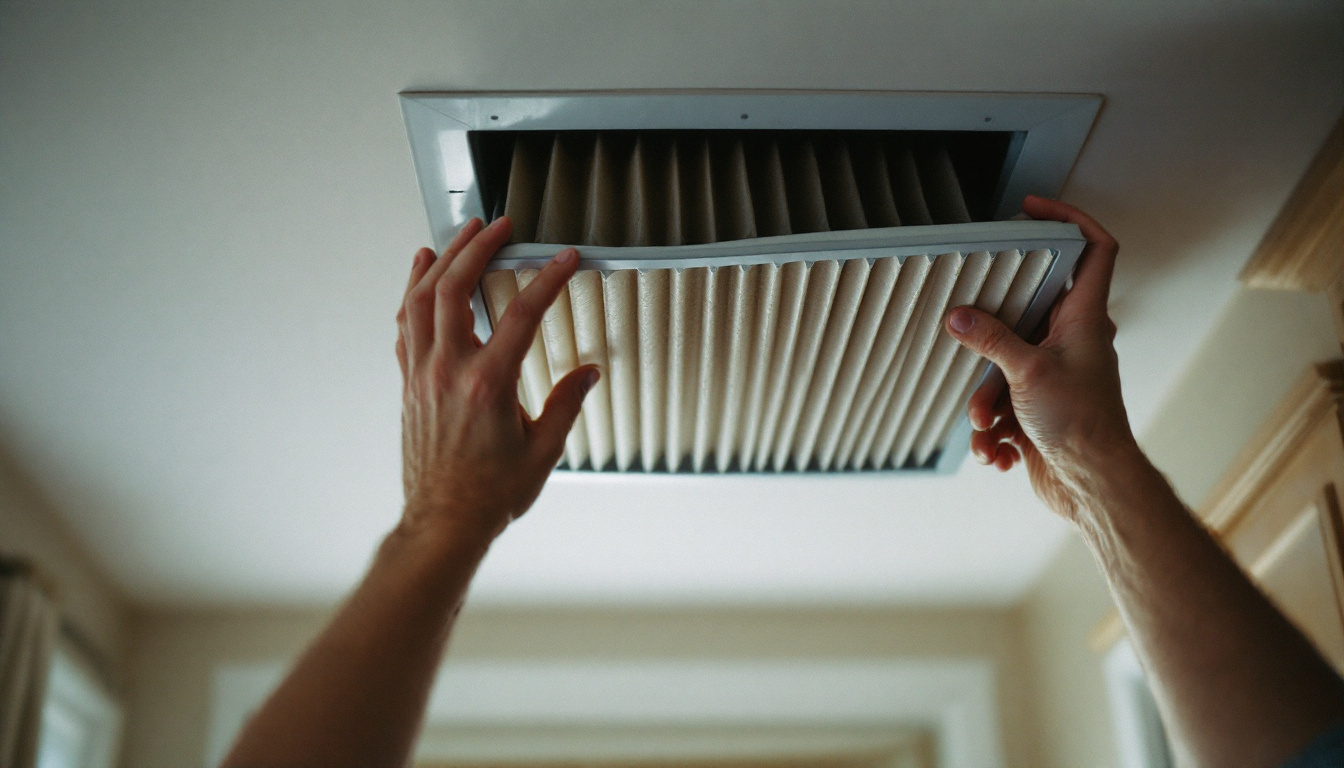
    The one maintenance task with a clear mechanism behind it is the air filter. A restricted filter raises static pressure across the blower, which is exactly the condition SEER2 testing was changed to represent more honestly.

    We separate what is actually established from what is repeated. That distinction matters here because maintenance advice is also a sales channel, and the interval you are told often matches a service plan rather than a measurement.

    What is established and what is not

    Claim Status
    Restricted filters raise static pressure and reduce airflow Established mechanism, and the reason SEER2 testing raised external static pressure
    Refrigerant circuits should not lose charge in normal operation Established. A system needing recharging has a leak
    Annual professional servicing is required Trade and manufacturer guidance, not federal requirement
    Maintenance extends equipment life by a specific number of years Not measured by any federal source
    Maintenance saves a specific percentage on bills Not measured by any federal source

    The tasks that have a mechanism behind them

    1. Change or clean the filter on schedule. The interval depends on filter type, pets and occupancy, not on the calendar alone. This is the one task with a direct, well understood effect on airflow.
    2. Keep the outdoor coil clear. Vegetation and debris restrict heat rejection, which the equipment cannot compensate for.
    3. Check the condensate drain. A blocked drain causes water damage, which is a failure mode independent of equipment performance.
    4. Have refrigerant charge verified rather than topped up. A system low on charge has a leak, and repeatedly adding refrigerant treats the symptom while venting a controlled substance.
    5. Have static pressure measured at least once. If ductwork is the constraint, no amount of servicing the equipment fixes it.
    On “maintenance saves you money” claims

    The percentage savings figures attached to maintenance plans are not from federal measurement. The defensible version is narrower: restricted airflow measurably degrades performance, and a refrigerant leak both costs money and worsens as refrigerant prices rise under phasedown. Those are mechanisms, not a percentage.

    Frequently asked questions

    How often should HVAC be serviced?

    Common trade guidance is annually, or twice yearly on a system that both heats and cools, but no federal agency sets or measures a required interval. It is manufacturer and industry advice rather than regulation. Filter changes are the task with the clearest mechanism and should follow filter type and household conditions rather than a fixed calendar.

    How often should I change my HVAC filter?

    It depends on filter type, pets, occupancy and how much the system runs, so no single interval applies. The mechanism is well established: a restricted filter raises static pressure across the blower and reduces airflow, which is the condition SEER2 testing was revised to represent more accurately.

    Does HVAC maintenance really save money?

    The specific percentage savings quoted with service plans are not measured by any federal source. What is defensible is narrower: restricted airflow degrades performance, and a refrigerant leak costs more as prices rise under federal phasedown. Treat percentage claims as marketing unless a source is named.

    Does my system need refrigerant topped up each year?

    No. A sealed refrigerant circuit should not lose charge in normal operation. A system that needs refrigerant has a leak, and repeatedly adding refrigerant treats the symptom while venting a controlled substance. Ask for the leak to be found rather than the charge to be topped up.

    Methodology and limitations

    We publish no service interval or savings percentage because no federal source measures either. The static pressure point references the SEER2 test procedure change under 10 CFR 430.32. Refrigerant handling context is from 40 CFR 84.

    • No federal requirement sets a residential HVAC servicing interval.
    • Manufacturer warranty terms may require documented maintenance. That is a contractual matter between you and the manufacturer.
    • Nothing here is engineering advice for a specific system.

    Sources

    1. US Department of Energy, 10 CFR 430.32, efficiency standards and the SEER2 test basis.
    2. US Environmental Protection Agency, 40 CFR part 84, hydrofluorocarbon management.

    The HVAC Brief is an independent trade publication. We do not sell equipment, take manufacturer advertising, or accept payment for placement in our research. Corrections welcome.
  • AC Repair Costs: Why No Reliable National Figure Exists

    AC Repair Costs: Why No Reliable National Figure Exists

    Last reviewed: August 2026 · By the HVAC Brief Editorial Team · Our sourcing and editorial standards

    The short answer

    No federal series tracks what a capacitor, compressor or coil replacement costs, so every price range published on this topic is a vendor survey or a contractor estimate. We do not publish one, because we cannot verify it.

    What is measurable is the direction of the inputs. Producer prices for HVAC equipment are up 60% since 2019 and contractor wages are up meaningfully over the same period, so parts and labour have both moved.

    This page tells you what determines the bill, which repairs change the replace-or-repair calculation, and how to sanity check a quote without a national average that does not exist.

    Why no reliable national figure exists

    Cost element Measured federally?
    Component at the factory Partly. BLS PPI covers equipment manufacturing, not individual spare parts
    Distributor and contractor parts markup No
    Diagnostic and labour time No. BLS publishes wages, not job pricing
    Refrigerant, where a repair needs it No residential price series
    Service call minimums No

    Four of five elements are unmeasured. A published range for a capacitor replacement is describing one sample of contractors at one moment, which is why the ranges you find disagree by multiples.

    The repairs that change the decision

    Component repairs sort into two groups: cheap parts that fail routinely, and expensive failures that push you toward replacing the system.

    1. Capacitor. A common wear part. Failure stops the compressor or fan starting. Replacement is a small part plus a short visit and does not change the case for keeping the system.
    2. Contactor. Similar category. Electrical wear item, routine replacement.
    3. Blower motor. Middling. Worth weighing against system age and refrigerant type.
    4. Evaporator or condenser coil. Expensive, and on an R-410A system it means recovering and recharging a refrigerant being phased down.
    5. Compressor. The failure that most often makes replacement the better option, because the part, the labour and the refrigerant all land at once.
    The refrigerant question changes repair economics

    Any repair that opens the refrigerant circuit on an R-410A system commits you to a refrigerant under federal phasedown, which will get more expensive across the remaining life of the equipment. That does not make the repair wrong, but it belongs in the comparison. See what the R-410A rule actually says.

    How to sanity check a repair quote

    1. Ask for the part and the labour separately, the same discipline that applies to a full replacement quote.
    2. Ask what failed and why. A capacitor that fails twice in two seasons is a symptom, not a part problem.
    3. For any refrigerant-circuit repair, ask what the system is charged with and what that refrigerant costs to source now.
    4. For a compressor or coil, ask for the replacement quote alongside the repair quote. That is the only way to compare properly.
    5. Get the diagnostic in writing before authorising work.

    Frequently asked questions

    How much does it cost to replace an AC capacitor?

    No federal source publishes component repair prices, so any figure you see is a vendor survey or contractor estimate rather than measured data. A capacitor is a small wear part plus a short service visit, and it is at the inexpensive end of HVAC repairs. Ask for part and labour separately to judge a specific quote.

    How much does an AC compressor replacement cost?

    Not published by any federal series. A compressor is the failure most likely to make full replacement the better economic choice, because the part, the labour and the refrigerant recovery and recharge all arrive together. Ask for a replacement quote alongside the repair quote before deciding.

    Why do repair cost estimates vary so much online?

    Because none of them come from measured data. Four of the five cost elements, parts markup, labour time, refrigerant and service minimums, are not tracked by any federal series. Published ranges reflect one sample of contractors at one moment and differ by region, season and equipment.

    Is it worth repairing an old air conditioner?

    It depends on which component failed and what refrigerant the system uses. Cheap wear parts rarely justify replacement. A compressor or coil failure on an R-410A system commits you to a refrigerant under federal phasedown, which belongs in the calculation alongside the repair price.

    Methodology and limitations

    We publish no component price range because no primary source supports one. Input direction is from BLS producer price series PCU333415333415 and BLS Current Employment Statistics for NAICS 238220. Refrigerant status is from 40 CFR 84.54 and EPA final rule 91 FR 31284.

    • No federal series prices individual HVAC spare parts or repair jobs.
    • The ordering of repairs from cheap to expensive reflects the components involved, not measured price data.
    • Nothing here is a quote or an estimate for any specific job.

    Sources

    1. US Bureau of Labor Statistics, Producer Price Index series PCU333415333415; Current Employment Statistics, NAICS 238220.
    2. 40 CFR 84.54 and EPA final rule 91 FR 31284, for refrigerant phasedown status.

    The HVAC Brief is an independent trade publication. We do not sell equipment, take manufacturer advertising, or accept payment for placement in our research. Corrections welcome.
  • Heat Pump vs Gas Furnace: What the Installed Data Shows

    Heat Pump vs Gas Furnace: What the Installed Data Shows

    Last reviewed: August 2026 · By the HVAC Brief Editorial Team · Our sourcing and editorial standards

    The short answer

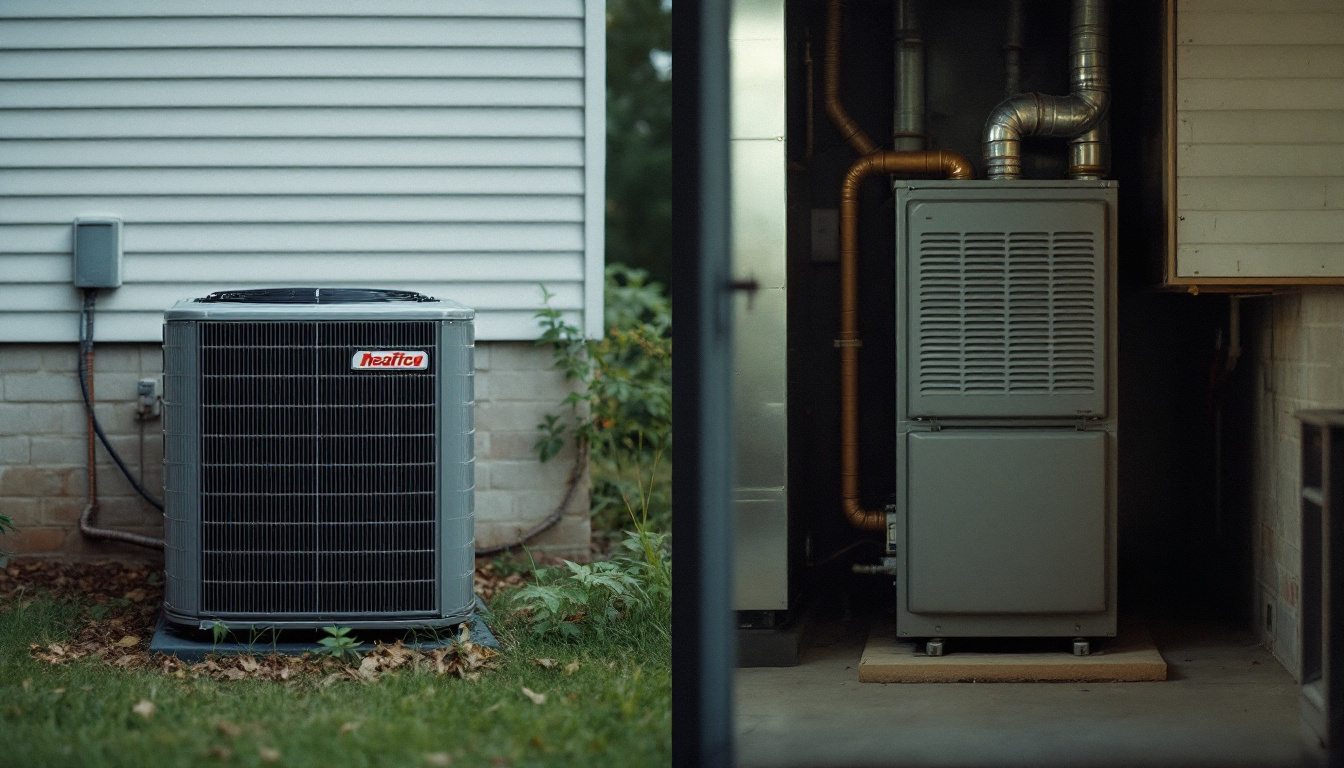
    Gas furnaces heat 53.26 million US homes against 16.13 million for heat pumps, but heat pumps now take about 46% of new central shipments. The installed base says furnace, the new-sales data says heat pump, and both are true at once.

    The decision turns on what you pay for fuel against what you pay for electricity where you live. Heating oil, for one comparison point, averaged $4.01 a gallon last season and peaked at $5.57.

    What US homes actually run

    Main heating equipment Homes (million) Share of stock
    Natural gas central furnace 53.26 43.1%
    Heat pump 16.13 13.1%
    Electric central furnace 13.82 11.2%

    Gas furnaces heat more than three times as many homes as heat pumps. That is the installed base, from EIA RECS 2020, and it moves slowly because equipment stays in service for a long time.

    What is being installed now

    Through June 2026, air-source heat pumps were 2,156,549 of 4,716,688 combined central shipments, about 46%. Two years earlier the share was 42%. The category did not grow: air conditioner shipments fell by roughly the same number of units that heat pumps gained.

    Our full shipment analysis sets out the near unit-for-unit substitution behind that shift.

    How the comparison actually works

    Factor Gas furnace Heat pump
    Provides cooling No, needs a separate air conditioner Yes, one machine does both
    Energy source Natural gas, propane or oil Electricity
    Cost driver Fuel price and burner efficiency Electricity price and coefficient of performance
    Cold weather behaviour Output largely independent of outdoor temperature Efficiency falls as outdoor temperature drops
    Federal minimum efficiency Set by DOE for furnaces 14.3 SEER2 and 7.5 HSPF2 for split systems
    Regional efficiency rules Applies to furnaces separately No regional air conditioner standard applies

    The honest version of the running-cost comparison is that it depends on local fuel and electricity prices, which vary enormously by state and by season. We publish the heating oil series because EIA measures it weekly; we do not publish a national gas-versus-electric running cost, because the answer changes by utility territory.

    Where a heat pump changes the maths most

    Homes currently heating with oil or propane face fuel prices that move sharply. Heating oil averaged $4.01 a gallon in the 2025/26 season, up 9.8%, with a peak of $5.57. Homes on cheap natural gas face a much closer comparison. See our heating oil price index.

    Frequently asked questions

    Is a heat pump better than a gas furnace?

    It depends on local energy prices and climate. A heat pump provides heating and cooling in one machine and runs on electricity; a gas furnace provides heat only and needs a separate air conditioner. Gas furnaces still heat 53.26 million US homes against 16.13 million for heat pumps, but heat pumps take about 46% of new central shipments.

    Do heat pumps work in cold weather?

    They operate in cold weather, but efficiency falls as outdoor temperature drops, which is why performance is rated separately as HSPF2. Federal minimum for split system heat pumps is 14.3 SEER2 and 7.5 HSPF2. Whether that is economical against a furnace depends on your electricity price and local design temperatures.

    Are heat pumps replacing furnaces?

    Not directly. The shipment shift is heat pumps taking share from air conditioners, not from furnaces: air conditioner shipments fell about 159,222 units between the 2024 and 2026 year-to-date periods while heat pumps rose about 159,379. Gas furnaces remain the largest installed heating category.

    Which is cheaper to run?

    It depends on local fuel and electricity prices, which vary by utility territory and season, so no honest national answer exists. Homes heating with oil face the most volatile input: heating oil averaged $4.01 a gallon in 2025/26 and peaked at $5.57.

    Methodology and limitations

    Installed base is EIA RECS 2020, tables HC6.1 and HC7.1. Shipments are the AHRI June 2026 Statistical Release. Heating oil is EIA series W_EPD2F_PRS_NUS_DPG. Efficiency minimums are 10 CFR 430.32.

    • We publish no national running-cost comparison. Fuel and electricity prices vary too much by territory for a single figure to be meaningful.
    • RECS 2020 remains the current vintage for equipment data; the 2024 survey’s heating and cooling tables are due in spring 2027 See what the 2024 survey release covers.; the installed base has moved since.
    • Shipments measure movement into distribution, not installations.

    Sources

    1. US Energy Information Administration, RECS 2020 tables HC6.1 and HC7.1; weekly heating oil series W_EPD2F_PRS_NUS_DPG.
    2. Air-Conditioning, Heating, and Refrigeration Institute, June 2026 Statistical Release.
    3. US Department of Energy, 10 CFR 430.32.

    The HVAC Brief is an independent trade publication. We do not sell equipment, take manufacturer advertising, or accept payment for placement in our research. Corrections welcome.

  • How Long Does an HVAC System Last? Nobody Actually Measures It

    How Long Does an HVAC System Last? Nobody Actually Measures It

    Last reviewed: September 2026 · By the HVAC Brief Editorial Team · Our sourcing and editorial standards

    The short answer

    No federal agency publishes an average HVAC system lifespan, and the “15 to 20 years” figure repeated across the web has no primary source behind it. It circulates because one page copied another, not because anyone measured it.

    What is documented is the consequence of long equipment life. Heat pumps take about 46% of new central shipments but heat only 13.1% of homes, a gap that exists precisely because equipment stays installed for a long time.

    Correction, September 2026: An earlier version of this page said EIA publishes no data on the age of installed equipment. RECS 2020 tables HC6.1 and HC7.1 do report equipment age in bands. We have added those figures below. No federal source publishes an average service life.

    We went looking for a federal lifespan figure and could not find one. The Energy Information Administration’s Residential Energy Consumption Survey records what equipment homes have, not how old it is or when it failed. That absence is worth stating plainly, because it explains why every number you see differs.

    What nobody publishes

    Question Federal source?
    What equipment US homes have Yes, EIA RECS tables HC6.1 and HC7.1
    How many units ship each year Yes, AHRI monthly statistical releases
    Age of installed equipment Yes, in age bands, RECS tables HC6.1 and HC7.1, no average published
    Average service life before replacement No
    Failure rate by equipment age No

    The lifespan claims you find come from manufacturer literature, contractor experience and home-warranty marketing. Those are legitimate inputs, but they are not measurements, and they carry obvious incentives in both directions.

    What the shipment data implies

    There is an indirect way to think about it. Roughly 4.7 million central air conditioners and heat pumps shipped in the first half of 2026, and EIA counts about 123.5 million US housing units with 109.5 million using air conditioning. Annualising shipments against the installed cooling base implies a replacement cycle measured in well over a decade.

    We stop short of turning that into a lifespan number, because shipments include new construction and second systems, and because the installed base figure is from 2020. The arithmetic supports “long”, not a specific year count.

    Why the gap matters more than the number

    Heat pumps are near half of new shipments but around 13% of homes. That gap is the clearest available evidence that residential HVAC equipment stays in service for a long time, and it is measured rather than asserted. See our shipment share analysis.

    What actually determines replacement timing

    1. Refrigerant. An R-410A system still works, but service refrigerant is being phased down and will cost more over the remaining life. See what the R-410A rule says.
    2. Repair cost against replacement cost. A compressor or coil failure changes the calculation sharply; a capacitor does not.
    3. Efficiency floor in your region. Minimum efficiency is federally set and varies regionally, so the replacement is not always like-for-like. See SEER2 requirements.
    4. Whether the original install was correct. Oversized or badly ducted systems fail earlier and perform worse throughout.
    5. Equipment price trend. Producer prices are up 60% since 2019 and August 2026 was the series high, so deferring has carried a cost.

    How old installed equipment actually is

    EIA does publish the age of the equipment in American homes, in bands rather than as an average: 20.0% of homes that heat run main heating equipment 20 years old or more, and 9.6% of air conditioned homes run main cooling equipment that old.

    Age of main equipment Heating, homes (millions) Share Cooling, homes (millions) Share
    Less than 2 years 13.29 11.3% 15.63 14.3%
    2 to 4 years 17.19 14.6% 21.76 19.9%
    5 to 9 years 26.77 22.7% 30.08 27.5%
    10 to 14 years 22.29 18.9% 20.49 18.7%
    15 to 19 years 14.66 12.5% 11.01 10.1%
    20 years or more 23.54 20.0% 10.55 9.6%

    Heating shares are of the 117.74 million homes using heating equipment (RECS 2020 table HC6.1); cooling shares are of the 109.51 million using air conditioning (table HC7.1). Ages are reported by households and cover all equipment types. The distribution shows that a large share of systems run well past 15 years, but it is not a service life: it describes equipment still in use, not when equipment failed or was replaced.

    Frequently asked questions

    How long does an HVAC system last?

    No federal agency publishes an average service life, and the commonly repeated 15 to 20 year range has no primary source. EIA publishes what equipment homes have and how old it is, in age bands, but not service life or failure rates. Replacement timing depends on refrigerant, repair versus replacement economics, install quality and regional efficiency rules rather than on a fixed number of years.

    Where does the “15 to 20 years” figure come from?

    Manufacturer literature, contractor experience and home-warranty marketing, repeated across websites until it reads as established fact. It is not published by EIA, BLS, DOE or any other federal source, and the federal survey of installed equipment age reports age bands, not a service life.

    When should I replace my HVAC system?

    Weigh the repair cost against replacement, whether the system uses R-410A whose service refrigerant is being phased down, and what your region’s minimum efficiency requires. Producer prices for equipment are up 60% since 2019 with August 2026 the highest reading, so deferring has historically cost money.

    Does an older HVAC system cost more to run?

    Federal minimum efficiency has risen over time, so a system meeting a 2015 standard has a lower floor than one meeting the 2023 SEER2 standard. Actual running cost depends on the specific equipment, ductwork, climate and usage, none of which a general lifespan figure captures.

    Methodology and limitations

    EIA RECS 2020 tables HC6.1 and HC7.1 publish the age of main heating and cooling equipment in bands; we found no federal failure-rate or service-life data. Shipment figures are the AHRI June 2026 Statistical Release. Installed base is EIA RECS 2020. Equipment prices are BLS PCU333415333415.

    • We publish no lifespan figure because no primary source supports one.
    • The shipment-to-installed-base comparison is indicative only. Shipments include new construction and additional systems.
    • RECS 2020 remains the current vintage for equipment data; the 2024 survey’s heating and cooling tables are due in spring 2027 See what the 2024 survey release covers. and we do not extrapolate it forward.

    Sources

    1. US Energy Information Administration, Residential Energy Consumption Survey 2020, tables HC6.1 and HC7.1.
    2. Air-Conditioning, Heating, and Refrigeration Institute, June 2026 Statistical Release.
    3. US Bureau of Labor Statistics, Producer Price Index series PCU333415333415.

    The HVAC Brief is an independent trade publication. We do not sell equipment, take manufacturer advertising, or accept payment for placement in our research. Corrections welcome.
  • What Size HVAC System Do I Need? Why Square Footage Fails

    What Size HVAC System Do I Need? Why Square Footage Fails

    Last reviewed: August 2026 · By the HVAC Brief Editorial Team · Our sourcing and editorial standards

    The short answer

    System size should come from a room-by-room load calculation, not from square footage. The square-foot rules of thumb that circulate online ignore insulation, window area, orientation, air leakage and local climate, which is why they routinely oversize equipment.

    No federal agency publishes a sizing formula. What the Department of Energy does state is that oversized equipment short cycles, dehumidifies poorly and wears faster, so bigger is not safer.

    This page explains what a real load calculation accounts for, why the shortcuts fail, and what to ask a contractor. It does not give you a square-foot number, for a reason set out below.

    Why square-foot rules fail

    A rule of thumb converts floor area straight into capacity, treating every house of the same size as identical. Two homes of 2,000 square feet can differ by a factor of two in heat gain depending on insulation, window area and orientation, shading, air tightness and climate zone.

    The error is asymmetric. Contractors who guess tend to guess high, because an undersized system generates complaints on the hottest day while an oversized one generates complaints that are harder to attribute. That is how oversizing became the default failure mode.

    What oversizing actually costs

    An oversized air conditioner reaches the thermostat setpoint quickly and shuts off, which is called short cycling. Because dehumidification happens while the coil runs, short cycles leave the house cool and clammy. The equipment also starts and stops more often, and start-up is when compressors wear.

    What a proper load calculation includes

    1. Climate data for your location. Design temperatures, not record extremes.
    2. Building envelope. Wall and ceiling insulation values, construction type, foundation.
    3. Windows. Area, orientation, glazing type and shading. Often the single largest cooling variable.
    4. Air leakage. Measured or estimated infiltration rate.
    5. Internal gains. Occupants, appliances, lighting.
    6. Duct losses. Where the ducts run and whether that space is conditioned.
    7. Room-by-room results. Not just a whole-house total, because distribution matters as much as capacity.

    The industry-standard procedure for residential load calculation is ACCA Manual J, with Manual S for equipment selection and Manual D for duct design. These are private standards published by the Air Conditioning Contractors of America, not federal documents, which is part of why sizing guidance varies so much across the web.

    What to ask your contractor

    Ask this What a good answer sounds like
    Did you perform a load calculation? Yes, a room-by-room Manual J, and here is the output
    What design temperatures did you use? Local design conditions, not record highs or lows
    Did you measure or estimate infiltration? Either is acceptable if stated; silence is not
    Was the ductwork evaluated? Static pressure checked, duct sizing reviewed against the load
    Why this capacity rather than the next size up? A reason tied to the calculation, not to habit

    A contractor who sizes from a load calculation will hand you the output without being pushed. One who sizes from the old unit’s capacity is repeating whatever error was made last time, which is the most common way oversizing propagates across equipment generations.

    Why we do not publish a BTU-per-square-foot table

    Because it would be wrong more often than right, and because publishing one would make this page part of the problem it describes. Any table that turns floor area into tonnage has silently fixed values for insulation, glazing, infiltration and climate. Change any of those and the answer changes.

    What is documented and worth knowing is the equipment side: minimum efficiency is set federally and varies by region, so the sizing conversation and the efficiency conversation interact. Our SEER2 requirements guide sets out the floors that apply where you live.

    Frequently asked questions

    What size HVAC system do I need?

    The answer comes from a room-by-room load calculation for your specific house, normally ACCA Manual J, which accounts for climate, insulation, window area and orientation, air leakage, internal gains and duct losses. Square-foot rules of thumb ignore all of those and typically oversize, so no responsible national figure exists.

    Is a bigger HVAC system better?

    No. An oversized air conditioner short cycles, reaching setpoint and shutting off before it has removed enough humidity, which leaves a house cool and clammy. More frequent starts also accelerate compressor wear. Correct sizing outperforms oversizing on comfort, humidity and equipment life.

    What is a Manual J calculation?

    ACCA Manual J is the industry-standard residential load calculation procedure. It computes heating and cooling loads room by room from climate data, envelope construction, window area and orientation, infiltration, internal gains and duct losses. Manual S covers equipment selection and Manual D duct design. These are private standards, not federal regulations.

    Can I size a system from square footage?

    Not reliably. Two houses of identical floor area can differ roughly twofold in cooling load depending on insulation, glazing, shading, air tightness and climate zone. Square-foot rules embed fixed assumptions about all of those, so they are right only for houses matching the assumptions.

    Methodology and limitations

    This page describes procedure rather than publishing figures, because no federal agency publishes a residential sizing formula and the industry procedure is a private standard we do not reproduce. Efficiency minimums referenced here are from 10 CFR 430.32. Statements about oversizing behaviour describe the physical mechanism, short cycling and reduced dehumidification, rather than quantifying an effect we cannot source.

    • We publish no BTU-per-square-foot figure. Any such figure encodes assumptions that do not hold generally.
    • ACCA Manual J, S and D are private standards. We name them but do not reproduce their contents.
    • Nothing here is engineering advice. Sizing for a specific house requires a calculation for that house.

    Sources

    1. US Department of Energy, 10 CFR 430.32, for federal minimum efficiency standards.
    2. Air Conditioning Contractors of America, Manual J residential load calculation, Manual S equipment selection and Manual D duct design, named as the industry-standard procedures.

    The HVAC Brief is an independent trade publication. We do not sell equipment, take manufacturer advertising, or accept payment for placement in our research. Corrections welcome.
  • SEER2 Minimum Requirements: National and Regional Standards

    SEER2 Minimum Requirements: National and Regional Standards

    Last reviewed: August 2026 · By the HVAC Brief Editorial Team · Our sourcing and editorial standards

    The short answer

    SEER2 is the federal efficiency rating that replaced SEER for equipment manufactured on or after January 1, 2023. The national minimum is 13.4 SEER2 for split system air conditioners and 14.3 SEER2 with 7.5 HSPF2 for split system heat pumps.

    Air conditioners also carry a regional minimum that is higher than the national one. In the Southeast and Southwest, a split air conditioner under 45,000 Btu/hr must be at least 14.3 SEER2, and a unit rated below that cannot legally be installed there even though it can be sold elsewhere.

    The rating change is not cosmetic. SEER2 is measured under a higher external static pressure than SEER was, which better reflects real ductwork, so the same physical equipment scores lower on SEER2 than it did on SEER. A unit that was 14 SEER is not 14 SEER2.

    The national minimums

    Under 10 CFR 430.32(c)(5), central air conditioners and central air conditioning heat pumps manufactured on or after January 1, 2023 must meet these floors. HSPF2 applies only to heat pumps.

    Product class SEER2 minimum HSPF2 minimum
    Split system air conditioner, under 45,000 Btu/hr 13.4 n/a
    Split system air conditioner, 45,000 Btu/hr and over 13.4 n/a
    Split system heat pump 14.3 7.5
    Single-package air conditioner 13.4 n/a
    Single-package heat pump 13.4 6.7
    Small-duct, high-velocity 12.0 6.1
    Space-constrained air conditioner 11.7 n/a
    Space-constrained heat pump 11.9 6.3

    The regional minimums that catch people out

    Air conditioners carry a second, higher standard tied to where the unit is installed, not where it is sold. Under 10 CFR 430.32(c)(6), split system air conditioners installed on or after January 1, 2023 in the Southeast or Southwest must meet these levels.

    Product class Southeast SEER2 Southwest SEER2 Southwest EER2
    Split air conditioner, under 45,000 Btu/hr 14.3 14.3 11.7 or 9.8
    Split air conditioner, 45,000 Btu/hr and over 13.8 13.8 11.2 or 9.8

    Southeast covers Alabama, Arkansas, Delaware, Florida, Georgia, Hawaii, Kentucky, Louisiana, Maryland, Mississippi, North Carolina, Oklahoma, Puerto Rico, South Carolina, Tennessee, Texas, Virginia, the District of Columbia and the US territories. Southwest covers Arizona, California, Nevada and New Mexico. The regulation states that any outdoor unit model with a certified combination rated below the applicable regional level cannot be installed in that region.

    In the Southwest the EER2 requirement is conditional: 11.7 EER2 applies to units certified below 15.2 SEER2, and 9.8 EER2 applies at 15.2 SEER2 and above, with 11.2 and 9.8 for the larger capacity class.

    The practical consequence

    Regional standards attach to installation, not sale. A distributor in a Northern state can legally stock a 13.4 SEER2 split air conditioner that cannot be installed in Texas or Arizona. Heat pumps do not carry the regional air conditioner standard, which is one reason the regional rules push some markets toward heat pumps.

    What changed from SEER to SEER2

    Before January 1, 2023, equipment manufactured from 2015 had to meet SEER 13 for split air conditioners and SEER 14 with HSPF 8.2 for split heat pumps. Those figures are not comparable with the SEER2 numbers above, because the test procedure changed.

    Period Split AC minimum Split heat pump minimum
    Manufactured 2015 to 2022 13 SEER 14 SEER, 8.2 HSPF
    Manufactured 2023 onward 13.4 SEER2 14.3 SEER2, 7.5 HSPF2

    Because SEER2 testing uses higher external static pressure, converting between the two is approximate at best. Compare SEER2 with SEER2, and treat any single conversion factor you see quoted as a rule of thumb rather than a standard.

    Frequently asked questions

    What is the minimum SEER2 rating allowed?

    Nationally, 13.4 SEER2 for split system air conditioners and 14.3 SEER2 with 7.5 HSPF2 for split system heat pumps, for equipment manufactured on or after January 1, 2023, under 10 CFR 430.32(c)(5). Air conditioners installed in the Southeast or Southwest face a higher regional minimum of 14.3 SEER2 under 45,000 Btu/hr.

    What is the difference between SEER and SEER2?

    SEER2 replaced SEER for equipment manufactured from January 1, 2023 and is measured under higher external static pressure, which better represents installed ductwork. The same physical unit scores lower on SEER2 than on SEER, so the two ratings are not directly comparable and no exact conversion exists.

    Which states have higher SEER2 requirements?

    The Southeast region (Alabama, Arkansas, Delaware, Florida, Georgia, Hawaii, Kentucky, Louisiana, Maryland, Mississippi, North Carolina, Oklahoma, Puerto Rico, South Carolina, Tennessee, Texas, Virginia, the District of Columbia and the US territories) and the Southwest region (Arizona, California, Nevada and New Mexico) require split system air conditioners to meet 14.3 SEER2 under 45,000 Btu/hr and 13.8 SEER2 at or above that capacity. The Southwest adds an EER2 requirement.

    Can I install a 13.4 SEER2 air conditioner in Texas?

    No. Texas is in the Southeast region, where split system air conditioners under 45,000 Btu/hr installed on or after January 1, 2023 must be at least 14.3 SEER2. The regulation states an outdoor unit with a certified combination below the regional level cannot be installed there, even if it can be sold in other states.

    Do heat pumps have regional efficiency standards?

    The regional standards in 10 CFR 430.32(c)(6) apply to split system and single-package air conditioners, not heat pumps. Heat pumps meet the national minimum of 14.3 SEER2 and 7.5 HSPF2 for split systems nationwide.

    Methodology

    All figures are quoted from the current text of 10 CFR 430.32, Energy and water conservation standards and their compliance dates, paragraphs (c)(1) for the 2015 to 2022 standards, (c)(5) for the national SEER2 standards and (c)(6) for the regional standards, retrieved from the electronic CFR. We quote the regulation rather than paraphrasing it because the regional rules are the part most often reported incorrectly.

    Limitations

    • This covers federal minimums only. Utility rebate programmes and some state codes set higher thresholds.
    • Minimums are floors, not recommendations. The efficient choice for a specific house depends on climate, ductwork and run hours.
    • SEER and SEER2 are not interchangeable and we do not publish a conversion factor.
    • Nothing here is engineering or legal advice. Confirm the current standard for your region before specifying equipment.

    Sources

    1. US Department of Energy, 10 CFR 430.32, Energy and water conservation standards and their compliance dates, via eCFR.

    The HVAC Brief is an independent trade publication. We do not sell equipment, take manufacturer advertising, or accept payment for placement in our research. Corrections welcome.
  • What Is HVAC? The System, the Equipment and the Numbers

    What Is HVAC? The System, the Equipment and the Numbers

    Last reviewed: September 2026 · By the HVAC Brief Editorial Team · Our sourcing and editorial standards

    The short answer

    HVAC stands for heating, ventilation and air conditioning: the systems that heat, cool and move air through a building. In a US home it usually means one connected system, a heat source, a cooling source and the ductwork and fan that distribute air.

    Scale, from federal data: 109.5 million of 123.5 million US homes use air conditioning, gas furnaces heat 53.3 million, and 409,670 people work as HVAC mechanics and installers.

    What the letters mean

    Letter Function Typical residential equipment
    Heating Adds heat to the space Gas or electric furnace, heat pump, boiler
    Ventilation Exchanges and filters air Ductwork, blower, filters, fresh air intake, exhaust fans
    AC (air conditioning) Removes heat and humidity Central air conditioner, heat pump in cooling mode, mini split

    The ventilation letter is the one people skip, and it is the one that most often explains comfort complaints. A correctly sized furnace connected to undersized or leaking ductwork will still heat a house badly.

    What counts as an HVAC system in a house

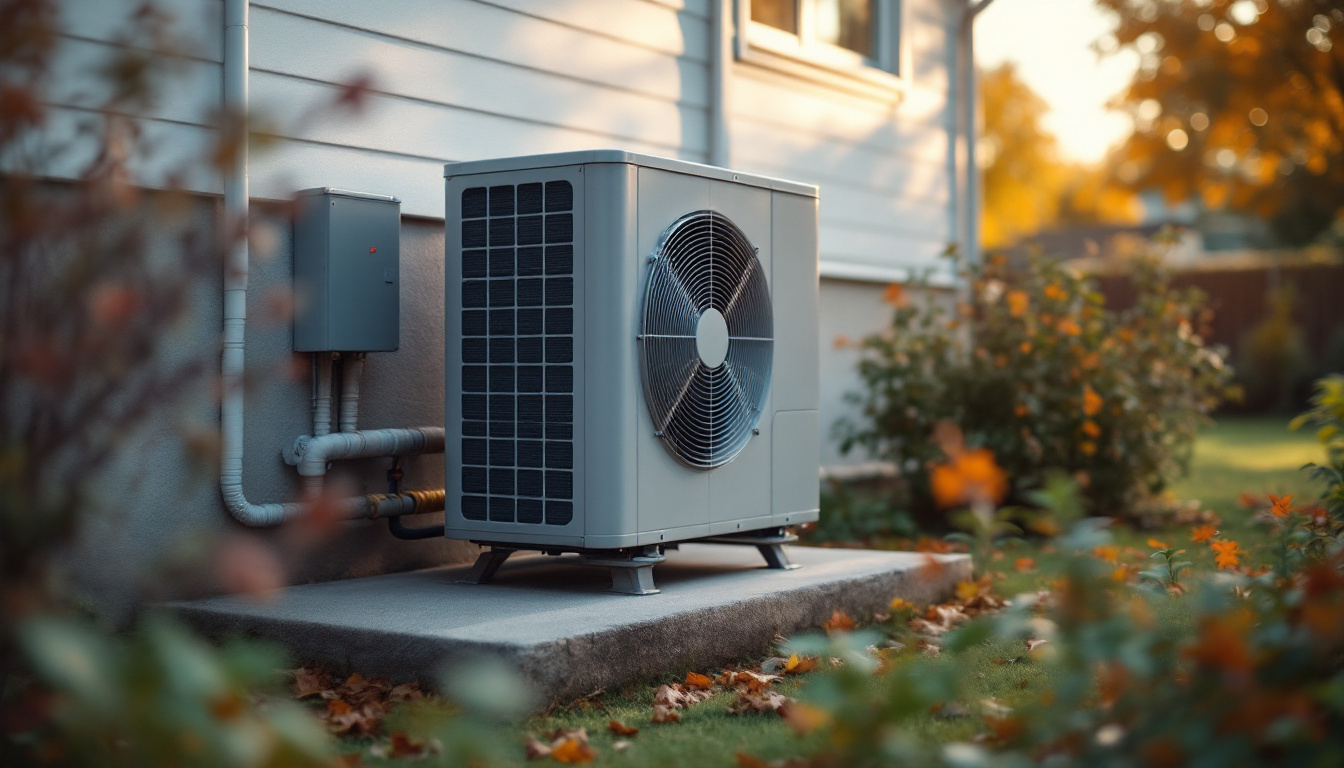
    Most US homes run a split system: an outdoor unit containing the compressor and condenser coil, an indoor unit containing the evaporator coil and blower, and ductwork connecting them to the rooms. A single thermostat controls it.

    A heat pump is the same architecture, but it can run the refrigerant cycle in both directions, so one machine both heats and cools. That is why heat pumps show up in both the heating and cooling statistics.

    1. Heat source. Gas furnace, electric furnace, heat pump or boiler.
    2. Cooling source. Air conditioner or heat pump.
    3. Air handler and ductwork. The blower and duct runs that distribute conditioned air.
    4. Controls. Thermostat and any zoning equipment.
    5. Filtration. The filter in the return, which is the part homeowners actually maintain.

    How common is each type

    Federal survey data gives the installed picture. Of 123.53 million US housing units, 109.51 million use air conditioning equipment, about 89%. On the heating side, natural gas central furnaces are the main equipment in 53.26 million homes and heat pumps in 16.13 million.

    Main heating equipment Homes (million) Share
    Natural gas central furnace 53.26 43.1%
    Heat pump 16.13 13.1%
    Electric central furnace 13.82 11.2%

    Heat pumps take a far larger share of new shipments than of the installed base, because equipment lasts a long time. Our shipment share analysis puts them near half of new central units against roughly 13% of homes.

    Who works on it

    The Bureau of Labor Statistics counted 409,670 heating, air conditioning and refrigeration mechanics and installers in May 2025, occupation code SOC 49-9021, at a median wage of $29.33 an hour. Counting everyone employed by plumbing, heating and air conditioning contractors, including office staff, the figure is about 1,355,400.

    Frequently asked questions

    What does HVAC stand for?

    Heating, ventilation and air conditioning. It refers to the connected systems that heat a building, move and filter air through it, and cool it. In most US homes that means one split system with an outdoor unit, an indoor air handler, ductwork and a thermostat.

    What is the difference between HVAC and air conditioning?

    Air conditioning is one part of HVAC. HVAC covers heating and ventilation as well as cooling. A central air conditioner handles cooling only, while a furnace or heat pump provides heat and the ductwork and blower provide ventilation and distribution.

    Is a heat pump an HVAC system?

    Yes. A heat pump runs the refrigerant cycle in both directions, so a single machine provides both heating and cooling. It appears in both heating and cooling statistics. Heat pumps are the main heating equipment in 16.13 million US homes per EIA RECS 2020.

    How many US homes have HVAC?

    109.51 million of 123.53 million US housing units use air conditioning equipment, about 89%, per EIA RECS 2020 table HC7.1. Nearly all homes have some heating equipment, with natural gas central furnaces the most common at 53.26 million homes.

    Methodology

    Installed equipment figures are EIA Residential Energy Consumption Survey 2020, tables HC6.1 and HC7.1, final data released March 2023, the current published vintage. Employment and wages are BLS OEWS SOC 49-9021 for May 2025 and BLS Current Employment Statistics series CEU2023822001 for NAICS 238220. RECS runs every five or six years, so 2020 remains current and we do not extrapolate it forward.

    Sources

    1. US Energy Information Administration, Residential Energy Consumption Survey 2020, tables HC6.1 and HC7.1.
    2. US Bureau of Labor Statistics, Occupational Employment and Wage Statistics, SOC 49-9021, May 2025; Current Employment Statistics, NAICS 238220.

    The HVAC Brief is an independent trade publication. We do not sell equipment, take manufacturer advertising, or accept payment for placement in our research. Corrections welcome.

  • Heat Pumps Took 3.4 Points of Share in Two Years. The Market Did Not Grow.

    Heat Pumps Took 3.4 Points of Share in Two Years. The Market Did Not Grow.

    Last reviewed: August 2026 · By the HVAC Brief Editorial Team · Our sourcing and editorial standards

    The short answer

    Heat pumps have taken 3.4 points of shipment share from air conditioners in two years, and the total market has not grown at all. Through June 2026, heat pumps were 45.7% of combined US shipments, against 42.3% in the same period of 2024.

    The substitution is almost exact. Air conditioner shipments fell by 159,222 units between the 2024 and 2026 year-to-date figures. Heat pump shipments rose by 159,379. The combined total moved by 157 units.

    Most coverage of heat pump adoption reports the growth rate and stops. The growth rate on its own is misleading, because it does not say whether heat pumps are expanding the market or replacing air conditioners inside a fixed one. The AHRI year-to-date table answers that directly, and the answer is replacement.

    Heat pumps gained almost exactly what air conditioners lost

    Between the January-to-June periods of 2024 and 2026, air conditioner shipments fell 159,222 units while air-source heat pump shipments rose 159,379. Net change across the combined category: 157 units on a base of about 4.7 million, or 0.003%.

    That is a market converting rather than growing. Every additional heat pump leaving a factory is very nearly matched by an air conditioner that did not.

    0k500k1,000k1,500k2,000k2,500k2024 Air conditioners: 2,719,3612.72M2024 Air-source heat pumps: 1,997,1702.00M2024 YTDheat pumps 42.3%2025 Air conditioners: 2,500,2542.50M2025 Air-source heat pumps: 2,076,8872.08M2025 YTDheat pumps 45.4%2026 Air conditioners: 2,560,1392.56M2026 Air-source heat pumps: 2,156,5492.16M2026 YTDheat pumps 45.7%Air conditionersAir-source heat pumpsUS shipments, January to June
    US year-to-date shipments through June, air conditioners against air-source heat pumps. Source: AHRI June 2026 Statistical Release, published August 14, 2026. Share calculations by The HVAC Brief.
    Year to date through June Air conditioners Heat pumps Combined Heat pump share
    2024 2,719,361 1,997,170 4,716,531 42.3%
    2025 2,500,254 2,076,887 4,577,141 45.4%
    2026 2,560,139 2,156,549 4,716,688 45.7%
    2024 to 2026 change -159,222 +159,379 +157 +3.4 pts

    Shipment share is not installed base

    Heat pumps take nearly half of new shipments but heat only 16.13 million of 123.53 million US homes, about 13.1%. Natural gas central furnaces remain the main heating equipment in 53.26 million homes, more than three times as many.

    Those figures come from the EIA Residential Energy Consumption Survey for 2020, the current published vintage for equipment data. The gap between shipment share and installed share is what a slow-moving stock looks like: equipment lasts fifteen years or more, so even a decisive shift in what ships takes a long time to show up in what is installed.

    Two practical consequences follow. Service revenue stays weighted toward gas equipment for years after new sales tip. And any claim that heat pumps have taken over residential heating is describing the shipment mix, not the housing stock. Our verified HVAC industry statistics set out both measures side by side.

    Why the total is not growing

    Combined AC and heat pump shipments are up 3.0% against 2025 but flat against 2024. Gas warm air furnace shipments are down 6.2% year to date. Residential water heater shipments fell on both fuels. Volume across the category is stagnant.

    Prices are the other half of the picture. Producer prices for HVAC equipment have risen about 60% since 2019 while unit volumes have stood still, which means manufacturer revenue can grow on price alone. Our analysis of the price increase traces where that came from and what it means for a quote.

    What this means if you install

    Plan for mix change rather than volume growth. The work is shifting toward heat pump installs and away from straight cooling replacements, but the number of jobs is not rising. That argues for training and stocking around the mix shift, and for defending margin per job, rather than for hiring against expected volume. It also means A2L-capable heat pump competence is becoming table stakes rather than a differentiator.

    Methodology

    Shipment figures are from the AHRI June 2026 Statistical Release dated August 14, 2026, retrieved as a PDF from ahrinet.org. AHRI publishes the year-to-date table including a prior-prior year column, which is what makes the two-year comparison possible. Share percentages and the 2024 to 2026 changes are ours, calculated from that table. Installed base figures are EIA RECS 2020, tables HC6.1 and HC7.1, final data released March 2023.

    Limitations

    • Shipments measure units moving from manufacturers into distribution, not installations. They include channel stocking decisions.
    • AHRI covers participating manufacturers, so the data is close to but not identical with the whole market.
    • The near-exact offset between the air conditioner decline and the heat pump gain is what the published totals show. We do not claim a causal mechanism, because AHRI does not publish one.
    • RECS 2020 remains the current vintage for equipment data; the 2024 survey’s heating and cooling tables are due in spring 2027 See what the 2024 survey release covers.. The installed base has moved since 2020 and we do not extrapolate it forward.
    • Year-to-date figures cover January to June only and are not seasonally adjusted.

    Frequently asked questions

    What share of HVAC shipments are heat pumps?

    Air-source heat pumps were 45.7% of combined US central air conditioner and heat pump shipments through June 2026, up from 42.3% in the same period of 2024, per the AHRI June 2026 Statistical Release. In absolute terms that is 2,156,549 heat pumps against 2,560,139 air conditioners.

    Are heat pumps growing the HVAC market?

    No. They are taking share inside a flat market. Air conditioner shipments fell 159,222 units between the 2024 and 2026 year-to-date periods while heat pumps rose 159,379, leaving the combined total 157 units different on a base near 4.7 million.

    How many US homes have a heat pump?

    A heat pump is the main heating equipment in 16.13 million US homes, about 13.1% of 123.53 million housing units, per EIA RECS 2020. Natural gas central furnaces heat 53.26 million homes. Shipment share runs far ahead of installed share because equipment lasts fifteen years or more.

    Why do shipment share and installed share differ so much?

    Shipments describe what is being sold now; installed base describes what is already in homes. With service lives of fifteen years or more, a shift in what ships takes well over a decade to move the stock. Heat pumps near half of shipments against roughly 13% of homes is the expected gap, not a contradiction.

    Sources

    1. Air-Conditioning, Heating, and Refrigeration Institute, June 2026 Statistical Release, published August 14, 2026.
    2. US Energy Information Administration, Residential Energy Consumption Survey 2020, tables HC6.1 and HC7.1.
    3. US Bureau of Labor Statistics, Producer Price Index by Industry, series PCU333415333415.

    The HVAC Brief is an independent trade publication. We do not sell equipment, take manufacturer advertising, or accept payment for placement in our research. Corrections welcome.