Last reviewed: October 2026 · By the HVAC Brief Editorial Team · Our sourcing and editorial standards
This report sets out how many Americans die each year from unintentional carbon monoxide (CO) poisoning that is not caused by a fire, which consumer products are involved, and who dies, using the Consumer Product Safety Commission’s (CPSC) annual estimates. The latest edition, published in May 2026, covers deaths through 2022. It focuses on heating equipment, the category HVAC contractors install and service, and compares it with portable generators, which now kill more people. For fire deaths from heating equipment, see home heating fire statistics; for alarm requirements, see carbon monoxide detector placement.
CPSC estimates 238 non-fire CO deaths a year associated with consumer products in 2020 to 2022, and 274 in 2022 alone, the highest in its current series. Heating systems were involved in 76 of those deaths. The single largest heating subcategory is not the furnace: it is the portable propane heater.
Executive summary
CPSC estimated 274 unintentional non-fire CO poisoning deaths associated with consumer products in 2022, and an annual average of 238 (standard error about 18.8) for 2020 to 2022. CPSC rates its 2022 death-certificate data as 90 percent complete (95 percent for 2021), and Washington State had reported no certificates for 2018 to 2022 when the estimates were compiled, so recent years are likely to be revised upward. The 2022 figure is double the 137 estimated for 2012.
Engine-driven tools were associated with 46 percent of deaths in 2020 to 2022, almost all of them portable generators, and heating systems with 29 percent (68 a year). Within heating, portable heaters account for 31 deaths a year, 25 of them involving LP-gas (propane) heaters, while furnaces and boilers of all fuels account for 23. Natural gas furnaces, the most common heating system in the US, are associated with about 7 deaths a year.
CO deaths are seasonal and concentrated among older men. November through February accounted for 59 percent of deaths in 2020 to 2022. Seventy-seven percent of victims were male, and people aged 45 to 64, who are 25 percent of the population, were 41 percent of deaths. Rural and small-town residents are over-represented by about three times.
The long-run picture is a U-shape. CPSC’s estimates fell from about 280 to 340 deaths a year in the early 1980s, a mortality rate above 13 per 10 million people, to a low of 4.34 per 10 million around 2000, and have since risen to 7.15 per 10 million (2021, three-year centered average), driven mostly by generators.
Key findings
- Non-fire CO deaths from consumer products: 238 a year, 2020 to 2022 average; 274 in 2022 (CPSC).
- Heating systems: 68 deaths a year (29%); 76 in 2022.
- Generators: about 98 deaths a year (41%), the single product with the most CO deaths.
- Portable propane (LP) heaters: 25 deaths a year, more than all furnaces and boilers combined (23).
- Natural gas furnaces: about 7 deaths a year, roughly one per 7.6 million homes heated by a gas furnace (HVAC Brief calculation using EIA RECS 2020).
- 53 percent of deaths occur in the house itself; 13 percent in tents and temporary shelters; 11 percent in garages and other structures at the home.
- November to February: 59 percent of deaths. December and January: 16 percent each.
- Men: 77 percent of victims. Ages 45 to 64: 41 percent of deaths versus 25 percent of the population.
- Small towns and isolated rural areas: 15 percent of deaths versus 5 percent of the population.
- Mountain states: 14 percent of deaths versus 8 percent of the population.
- Heating systems’ share of CO deaths: 34 percent in 2012, 28 percent in 2022 (HVAC Brief calculation).
- CO mortality rate rose 65 percent between 2000 (4.34 per 10 million) and 2021 (7.15) (CPSC).
How many people die from carbon monoxide poisoning each year?
CPSC’s series counts deaths from unintentional, non-fire CO poisoning associated with consumer products under its jurisdiction. It excludes motor vehicle exhaust, fires, suicides and products outside CPSC’s remit, so it is smaller than the CDC’s all-cause count of unintentional CO deaths, which includes vehicles and other sources. CPSC’s estimate is the standard source for which household products are involved.
| Year | All products | Heating systems | Generators | Heating share |
|---|---|---|---|---|
| 2012 | 137 | 46 | 57 | 34% |
| 2013 | 146 | 43 | 56 | 29% |
| 2014 | 164 | 64 | 54 | 39% |
| 2015 | 172 | 37 | 84 | 22% |
| 2016 | 178 | 50 | 68 | 28% |
| 2017 | 188 | 41 | 95 | 22% |
| 2018 | 209 | 63 | 83 | 30% |
| 2019 | 254 | 73 | 100 | 29% |
| 2020 | 223 | 63 | 95 | 28% |
| 2021 | 216 | 66 | 107 | 31% |
| 2022 | 274 | 76 | 93 | 28% |
2018 to 2022 data collection is incomplete (CPSC). Source: CPSC, 2022 Annual Estimates, Table 1.
Carbon monoxide deaths by product
| Product | Deaths a year | Share |
|---|---|---|
| Engine-driven tools (all) | 110 | 46% |
| Generators, gasoline | 73 | 31% |
| Generators, unspecified fuel | 21 | 9% |
| Generators, LP | 4 | 2% |
| Other engine-driven tools | 11 | 4% |
| Heating systems (all) | 68 | 29% |
| Portable heaters | 31 | 13% |
| of which LP gas | 25 | 11% |
| of which kerosene | 6 | 2% |
| Furnaces, incl. boilers | 23 | 10% |
| of which natural gas | 7 | 3% |
| of which unspecified gas | 5 | 2% |
| of which LP gas | 4 | 2% |
| Unspecified heater or system | 8 | 3% |
| Room or space heaters | 4 | 2% |
| Wall or floor furnaces | 2 | 1% |
| Charcoal and charcoal grills | 14 | 6% |
| Ranges or ovens | 10 | 4% |
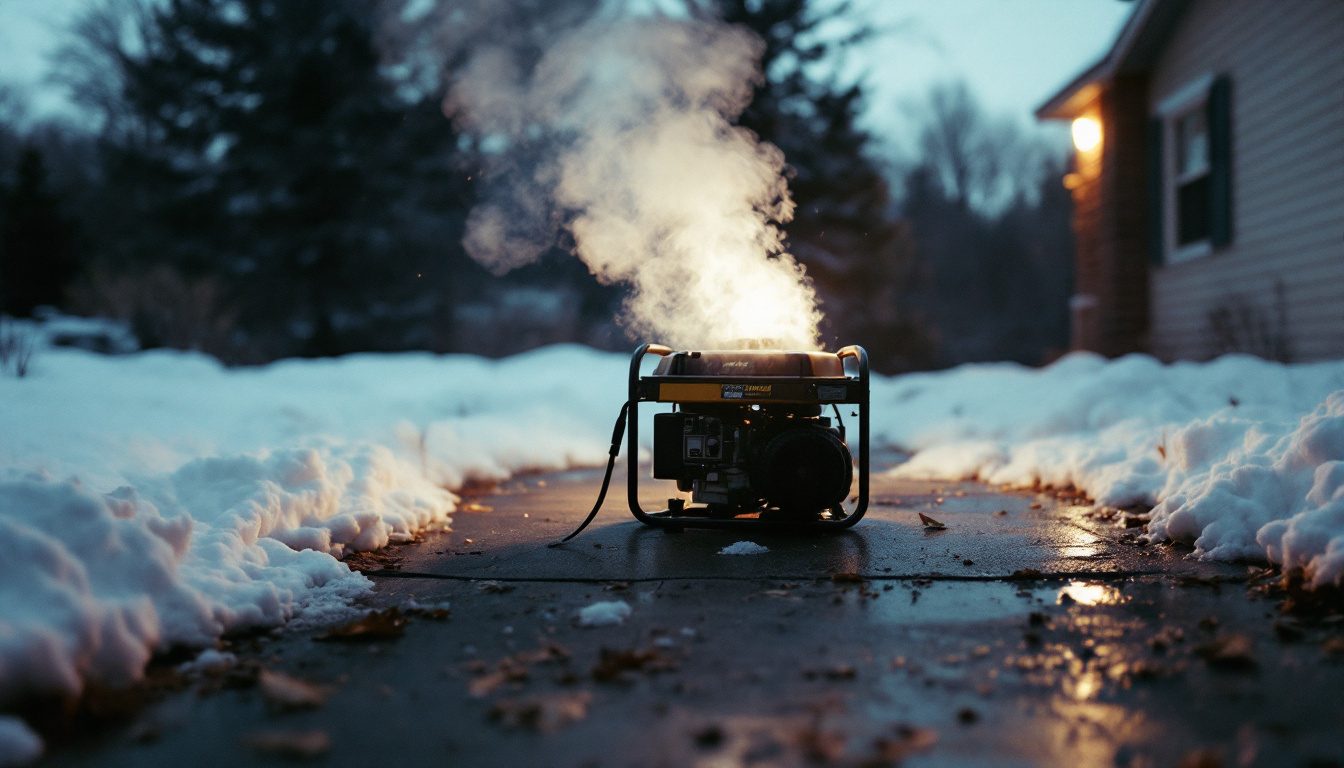
Generators dominate, as they have since the early 2000s. Among heating products, the ranking matters for HVAC professionals. Portable heaters (31 a year) kill more people than installed furnaces and boilers (23), and LP-gas portable heaters alone (25) exceed all furnaces. These are unvented heaters, including camping-style propane heaters, used indoors or in tents, garages and campers. Installed furnaces are vented to the outdoors and are associated with deaths mainly when venting, heat exchangers or combustion air fail.
| Year | All heating | Furnaces incl. boilers | Portable heaters | of which LP portable |
|---|---|---|---|---|
| 2012 | 46 | 27 | 11 | 10 |
| 2013 | 43 | 21 | 12 | 12 |
| 2014 | 64 | 24 | 18 | 14 |
| 2015 | 37 | 20 | 11 | 10 |
| 2016 | 50 | 34 | 11 | 6 |
| 2017 | 41 | 17 | 19 | 16 |
| 2018 | 63 | 27 | 24 | 24 |
| 2019 | 73 | 22 | 25 | 23 |
| 2020 | 63 | 23 | 33 | 28 |
| 2021 | 66 | 26 | 26 | 18 |
| 2022 | 76 | 20 | 34 | 30 |
Portable heater deaths roughly tripled over the decade, from 11 in 2012 to 34 in 2022, while furnace deaths stayed between 17 and 34 a year. CPSC attributes 76 heating-system deaths in 2022: 88 percent involved gas heating, of which LP gas accounted for 57 percent of heating deaths, natural gas 18 percent and unspecified gas 12 percent.
Where carbon monoxide deaths happen
| Location | Deaths a year | Share |
|---|---|---|
| Home (house) | 126 | 53% |
| Temporary shelter (tents, etc.) | 31 | 13% |
| Home, external structure (e.g. garage) | 27 | 11% |
| Home, but not a house (e.g. camper, shed) | 23 | 10% |
| Vehicles, incl. boats | 19 | 8% |
| Other / unknown | 12 | 5% |
Three-quarters of deaths happen at a home of some kind. The temporary shelter category, which includes tents, rose to 57 deaths in 2022 from about 20 a year a decade earlier, and is where portable fuel-burning heaters and generators are most often used in enclosed spaces.
When carbon monoxide deaths happen
Source: CPSC, 2022 Annual Estimates, Table 6.
November through February account for 59 percent of deaths, 141 a year on average, and December and January are the peak months at about 39 each. The winter peak reflects both heating and generator use during storm power outages. The warm months, May through August, still see about 41 deaths a year.
Who dies from carbon monoxide poisoning
| Age | Deaths a year | Share of deaths | Share of US population | Over- or under-representation |
|---|---|---|---|---|
| Under 5 | 2 | <1% | 6% | 0.1x |
| 5 to 14 | 5 | 2% | 13% | 0.2x |
| 15 to 24 | 11 | 5% | 13% | 0.4x |
| 25 to 44 | 56 | 24% | 27% | 0.9x |
| 45 to 64 | 98 | 41% | 25% | 1.6x |
| 65 and over | 65 | 27% | 17% | 1.6x |
Deaths are concentrated among adults 45 and over, who are 42 percent of the population and 68 percent of deaths. Children under 15 are 19 percent of the population and about 3 percent of deaths. Men are 77 percent of victims, a difference CPSC reports as statistically significant.
| Area | Deaths a year | Share of deaths | Share of population | Ratio |
|---|---|---|---|---|
| Urban core | 116 | 49% | 73% | 0.7x |
| Suburban | 55 | 23% | 15% | 1.5x |
| Large rural town | 31 | 13% | 6% | 2.2x |
| Small town / rural isolated | 35 | 15% | 5% | 3.0x |
| Northeast | 28 | 12% | 17% | 0.7x |
| Midwest | 59 | 25% | 21% | 1.2x |
| South | 84 | 35% | 38% | 0.9x |
| West | 69 | 29% | 24% | 1.2x |
Original synthesis (HVAC Brief calculations)
1. The furnace is not the main heating risk
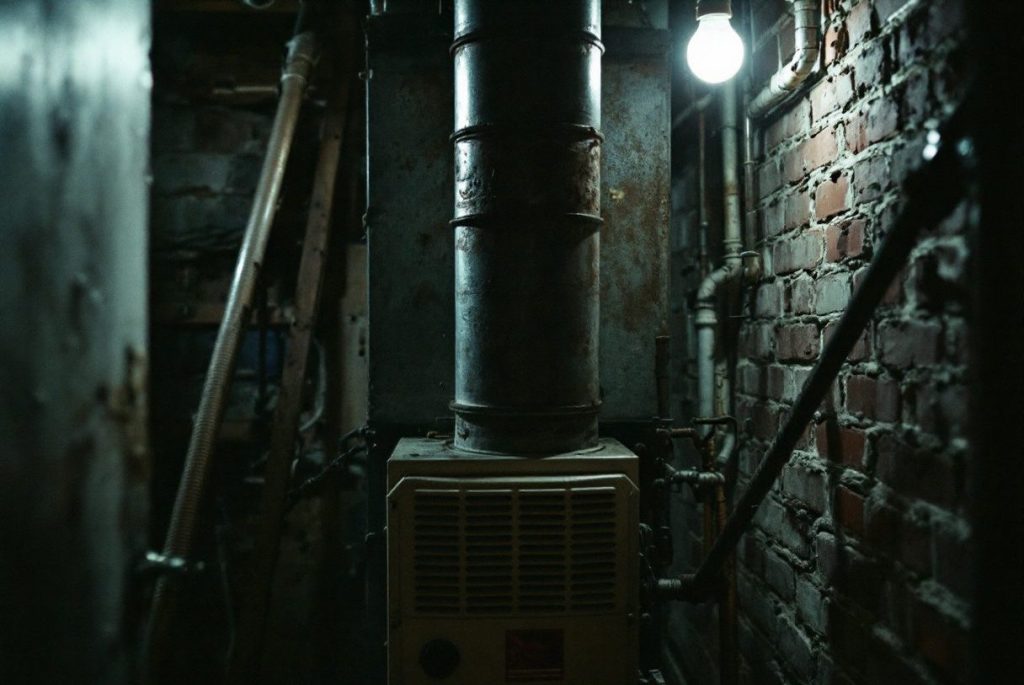
Natural gas central furnaces were the main heating system in about 53.3 million US homes in 2020 (EIA RECS). CPSC associates about 7 CO deaths a year with natural gas furnaces, about one death for every 7.6 million gas-furnace homes, or 0.13 per million a year (HVAC Brief calculation). Portable propane heaters, which are not a main heating system in most homes that use them, are associated with 3.6 times as many deaths. For contractors and inspectors, the evidence supports annual combustion and venting checks on installed equipment, but the larger avoidable toll is in unvented heaters, generators and charcoal used indoors.
2. Heating’s share is falling as generators rise
Heating systems were associated with 34 percent of CPSC’s estimated CO deaths in 2012 and 28 percent in 2022. Heating deaths rose in absolute terms over the decade (46 to 76), but the total rose faster (137 to 274). In the early 1990s, CPSC reported that most consumer-product CO deaths were associated with heating systems. Generators, which barely registered before 2000, are now the largest category, and CPSC’s generator mortality rate in 2021 was more than five times its 2000 level.
3. The U-shaped mortality curve
CPSC’s three-year centered mortality rate per 10 million population shows the long arc.
| Year | Rate |
|---|---|
| 1981 | 13.55 |
| 1990 | 10.53 |
| 2000 | 4.34 |
| 2010 | 5.07 |
| 2021 | 7.15 |
The decline from the 1980s to 2000 coincided with tighter appliance safety standards, the first UL standard for residential CO alarms (1992), wider adoption of CO alarms and the decline of older unvented heaters. The rise since then is mostly generators. A change in death-coding rules (ICD-9 to ICD-10) in 1999 breaks the series, so 1980s and post-1999 figures are not strictly comparable.
4. Rural over-representation
Small towns and isolated rural areas, home to 5 percent of the population, account for 15 percent of CO deaths, three times their share, and large rural towns twice their share. The Mountain division, 8 percent of the population, accounts for 14 percent of deaths. Likely contributors include greater use of propane, wood and portable heaters, reliance on generators during outages, and distance from emergency care. Urban cores, with 73 percent of the population, have 49 percent of deaths.
Charts worth building from this data
- Stacked area chart of CO deaths by product category, 2012 to 2022.
- Bar chart of heating subcategories: portable LP heaters vs furnaces.
- Line chart of CPSC mortality rate, 1981 to 2021.
- Population pyramid of CO deaths by age and sex vs population.
- Map of CO deaths by Census division vs population share.
Most quotable statistics
- About 238 Americans die each year from non-fire carbon monoxide poisoning linked to consumer products (CPSC, 2020-2022 average).
- CPSC estimated 274 non-fire CO deaths in 2022, double the 137 estimated for 2012.
- Portable propane heaters are linked to more CO deaths (25 a year) than all furnaces and boilers combined (23).
- Generators are linked to about 4 in 10 consumer-product CO deaths, heating systems to about 3 in 10.
- Seventy-seven percent of carbon monoxide poisoning victims are men (CPSC).
- Natural gas furnaces are linked to about one CO death a year for every 7.6 million homes they heat (HVAC Brief calculation).
Data limitations
- CPSC counts only unintentional, non-fire deaths associated with consumer products under its jurisdiction; vehicle exhaust and fire-related CO are excluded.
- CPSC measures data completeness at 98 percent for 2018 and 2020, 97 percent for 2019, 95 percent for 2021 and 90 percent for 2022; Washington State had reported no death certificates for those years as of September 2025. Recent estimates are likely to rise.
- Product attribution relies on death certificates and incident investigations; ‘unspecified’ categories are substantial.
- Small cells (single-digit annual counts) are unstable; the three-year average is more reliable than any single year.
- The per-home rate for gas furnaces uses RECS 2020 main heating equipment and does not account for homes using gas furnaces as secondary heat.
- The ICD-10 transition in 1999 breaks the long-run series.
Downloadable dataset: recommended fields
| Field | Description |
|---|---|
| year | Year of death |
| product_category | CPSC product category |
| fuel | Fuel type where reported |
| deaths_est | CPSC estimated deaths |
| location | Location of exposure |
| month | Month of death |
| age_group / sex | Victim demographics |
| density / region | RUCA density or Census region |
| mortality_rate_10m | Three-year centered rate per 10 million |
| data_complete_flag | CPSC completeness flag (2018+ incomplete) |
Press summary
About 238 Americans die each year from non-fire carbon monoxide poisoning linked to household products, and 274 died in 2022, double the 2012 figure, according to an HVAC Brief analysis of Consumer Product Safety Commission estimates. Heating equipment accounts for about 3 in 10 deaths, but the leading heating product is the portable propane heater, not the furnace. Generators are now the largest single cause. Victims are overwhelmingly men, middle-aged and older, and disproportionately rural.
Suggested headlines
- Carbon monoxide deaths have doubled in a decade
- Portable propane heaters kill more people than furnaces
- Why rural Americans are three times as likely to die of CO poisoning
- Generators overtook heating as the top carbon monoxide killer
- Your furnace is probably not the CO risk you think
Source quality ranking
| Source | Tier | Why |
|---|---|---|
| CPSC, Non-Fire CO Deaths Associated with Consumer Products, 2022 Annual Estimates (May 2026) | Tier 1 | Federal agency; death certificates plus incident investigations |
| EIA Residential Energy Consumption Survey 2020 | Tier 1 | Federal survey; denominator for per-home rate |
| CDC WONDER multiple cause of death | Not used | Covers all unintentional CO; access was unavailable for this report |
| Detector manufacturer statistics | Excluded | Commercial interest; methodology not disclosed |
Methodology
- All death estimates: CPSC, Non-Fire Carbon Monoxide Deaths Associated with the Use of Consumer Products, 2022 Annual Estimates, published May 2026, Tables 1 to 10 and Appendix B.
- 2020 to 2022 averages and shares are CPSC published values; annual product rows for 2012 to 2022 are from Table 1. Generator annual totals sum the gasoline, LP and unspecified-fuel generator rows.
- Heating share = heating systems row / total row. Per-home rate = natural gas furnace deaths (2020-2022 average) / RECS 2020 weighted homes with natural gas central furnace as main heat.
- Over-representation ratio = share of deaths / share of US population, using CPSC’s population shares.
Frequently asked questions
How many people die from carbon monoxide poisoning each year?
CPSC estimates 238 non-fire CO deaths a year associated with consumer products (2020 to 2022 average), and 274 in 2022. The CDC’s broader count, which includes vehicles, is higher.
What causes the most carbon monoxide deaths?
Portable generators, linked to about 98 deaths a year, or 41 percent. Heating systems are second, at 68 a year (29 percent).
How many carbon monoxide deaths are caused by furnaces?
About 23 a year for furnaces and boilers of all fuels, 7 of them natural gas furnaces (CPSC 2020 to 2022 average).
Are space heaters a carbon monoxide risk?
Fuel-burning portable heaters are. They are linked to 31 deaths a year, 25 of them propane heaters. Electric space heaters do not produce CO.
When are carbon monoxide deaths most common?
November through February, with 59 percent of deaths; December and January are the peak months.
Who is most at risk of carbon monoxide poisoning?
On death data, men (77 percent of victims), adults 45 and older (68 percent) and rural residents, who die at about three times their population share.
Are carbon monoxide deaths increasing?
Yes. CPSC’s estimate rose from 137 in 2012 to 274 in 2022, and the mortality rate rose 65 percent between 2000 and 2021, mostly because of generators.
Where do most carbon monoxide deaths happen?
53 percent in the house itself; another 21 percent in garages, campers, sheds and other home structures; 13 percent in tents and temporary shelters.
Does a carbon monoxide detector prevent deaths?
CO alarms provide warning before dangerous levels for most people. Our detector placement guide covers code requirements.
Why is the 2022 number so high?
CPSC’s 2022 estimate of 274 is the highest in the current series, driven by generators and portable heaters; it is also provisional and may rise further.
Cite this report
Sources
- US Consumer Product Safety Commission, Non-Fire Carbon Monoxide Deaths Associated with the Use of Consumer Products, 2022 Annual Estimates, May 2026.
- CPSC, Non-Fire Carbon Monoxide Deaths and Injuries (historical report).
- US Energy Information Administration, Residential Energy Consumption Survey 2020 microdata.
The HVAC Brief is an independent trade publication. We do not sell equipment, take manufacturer advertising, or accept payment for placement in our research. Corrections welcome.
Leave a Reply