If your house won’t cool below 75 only on days hotter than its design temperature (about 91°F in Atlanta, 95°F in Houston, 108°F in Phoenix), the AC is probably at capacity, not broken. If it also misses 75 with 85°F outside after dark, look for a fault.
How hot can it get before a correct system lets go of 73, 75, 76, 78 or 80?
Find your city: if today’s high is at or above the number under the temperature your house is stuck at, it is doing what it was sized to do. In Houston, 78 on a 99°F afternoon is capacity. The same 78 on a 90°F afternoon points to a fault.
| City | Holds 73 up to | Holds 75 up to | Holds 76 up to | Holds 78 up to | Holds 80 up to | Capacity needed at 85°F outside |
|---|---|---|---|---|---|---|
| Phoenix | 105°F | 108°F | 110°F | 113°F | 116°F | 41% |
| Dallas | 96°F | 98°F | 100°F | 103°F | 105°F | 56% |
| Houston | 92°F | 95°F | 96°F | 99°F | 102°F | 64% |
| Denver | 89°F | 92°F | 93°F | 96°F | 98°F | 73% |
| Atlanta | 89°F | 91°F | 93°F | 96°F | 98°F | 74% |
| Chicago | 86°F | 89°F | 90°F | 93°F | 96°F | 82% |
HVAC Brief calculation: hottest outdoor temperature at which a system sized exactly to a 75°F load holds each setpoint. A screening estimate, not your load calculation.
A system at the 15% oversizing limit reported for ENERGY STAR holds each setpoint 3 to 5°F hotter. Stored coolness delays the rise on a short peak, so these are long afternoon numbers. Denver carries no altitude correction.
Why is 75°F the number, and where does each city’s design day come from?
Because 75°F is what the load calculation assumes. An ACCA process overview at the 2018 ICC conference lists the Manual J heat gain condition as the 1% dry bulb outdoors and 75°F indoors, unless code says otherwise. The 1% value is exceeded about 88 hours in an average year (8,760 times 1%), and a correct system is expected to fall behind during them.
| Airport station | ASHRAE 1% dry bulb | ENERGY STAR county cap | Spread to 75°F | TMY3 hours at or above 1% value |
|---|---|---|---|---|
| Phoenix (Sky Harbor) | 108.1°F | 111°F | 33.1°F | 67 |
| Dallas (DFW) | 98.4°F | 99°F | 23.4°F | 39 |
| Houston (Bush) | 95.0°F | 95°F | 20.0°F | 105 |
| Denver (DIA) | 91.8°F | 92°F | 16.8°F | 106 |
| Atlanta (Hartsfield) | 91.4°F | 92°F | 16.4°F | 92 |
| Chicago (O’Hare) | 88.9°F | 91°F | 13.9°F | 68 |
Compiled by The HVAC Brief from ASHRAE 2009 data in DOE EnergyPlus station files (hours counted from TMY3 files) and the ENERGY STAR 2015 edition guide for the matching county.
The ENERGY STAR caps give each county its hottest station, so Maricopa reads 111°F (Gila Bend) against 108.1°F at Sky Harbor; your contractor’s file may use either. A Building America guide hosted by DOE states the outcome: “A properly sized system may only be able to cool to 76°F or 77°F rather than 75°F for these hours.” Run at each city’s 0.4% temperature, our equation returns 76.3 to 77.3°F, which agrees.
Does an AC really only cool 20 degrees below the outdoor temperature?
No. Design spreads run from 13.9°F in Chicago to 33.1°F in Phoenix, so no single gap describes a healthy system. Our page on the temperature split and the two 20 degree rules covers the coil side of that habit.
DOE’s Appendix M models heat gain as a straight line from zero at 65°F outdoors, so an Atlanta house gains 3.79% of its design load per outdoor degree. York’s 3 ton YC336E2S11 table loses about 0.52% capacity per degree from 95 to 105°F. Heat gain outruns capacity about 7 to 1, and the house settles where the lines meet again.
York also shows why the tonnage on the label oversells a hot afternoon. At 1,200 CFM that nominal 36,000 Btu per hour unit makes 34.0 kBtu/h at the 80°F, 67°F wet bulb rating condition, 30.9 at 75°F and 62°F wet bulb, and 27.9 with 115°F outside: 22.5% under nominal with nothing wrong.

How do you tell capacity from a fault in one evening?
Take four readings between 4 p.m. and bedtime with a probe thermometer and a return wet bulb.
- Log indoor and outdoor temperature hourly. A falling indoor reading means recovery; how long a house takes to cool is its own question.
- Compare the high with the first table.
- After 15 minutes of run time, measure the split. Proctor Engineering calls a split within 3°F of target “probably OK”: at a 78°F return and 63°F wet bulb the target is 20.2°F. More than 3°F high reads as low airflow, more than 3°F low as lost capacity, and low airflow plus low capacity can pass.
- Recheck at 85°F or cooler. The table’s last column is the capacity the house then needs, 74% in Atlanta and 41% in Phoenix, before counting the missing sun. The rest pulls temperature down, so the house should reach setpoint and cycle. Flat and nonstop at 85°F is not a capacity limit.
Which faults look exactly like a house stuck at 78, and how many degrees does each add?
Lost capacity moves the same balance point, so a fault reads like weather. NIST TN 1848 calls a 30% undercharge “a fault level commonly observed during field surveys.”
| Look-alike | Published capacity effect | Reading that points to it | Added indoor °F, Atlanta design day |
|---|---|---|---|
| Evaporator coil fouled until pressure drop doubles | 2% to 4% (LBNL modeled) | Split high; static pressure high across coil | 0.3 to 0.7 |
| Outdoor coil matted or recirculating, 10°F extra at the coil | About 5% per 10°F (York table slope) | Coil inlet air hotter than nearby shade air | 0.9 |
| 30% refrigerant undercharge | Almost 15% (NIST chamber); 54% at 27% undercharge (SCE, cited by NIST) | Split over 3°F low; superheat and subcooling off chart | 2.7 (NIST); 11.5 (SCE) |
| Leaky supply ducts in an attic or crawlspace | 20 to 30 percent of duct air lost (ENERGY STAR), counted as all lost capacity: an upper bound | Good split at the handler, weak registers; duct leakage test | 3.7 to 5.8 |
HVAC Brief calculation: each published loss applied to the balance equation at Atlanta’s 91.4°F design temperature. Compiled from LBNL, NIST, York and ENERGY STAR.
An owner can change the filter and rinse the outdoor coil with power off, as our coil cleaning guide describes. Refrigerant gauges, capacitors and line voltage belong to a technician, who should report superheat and subcooling against the maker’s chart, plus static pressure, before adding anything. Ice is its own branch: why a coil freezes. If the air is not cold at all, use the three step not cooling check.
What do attic ducts cost on a 97°F afternoon?
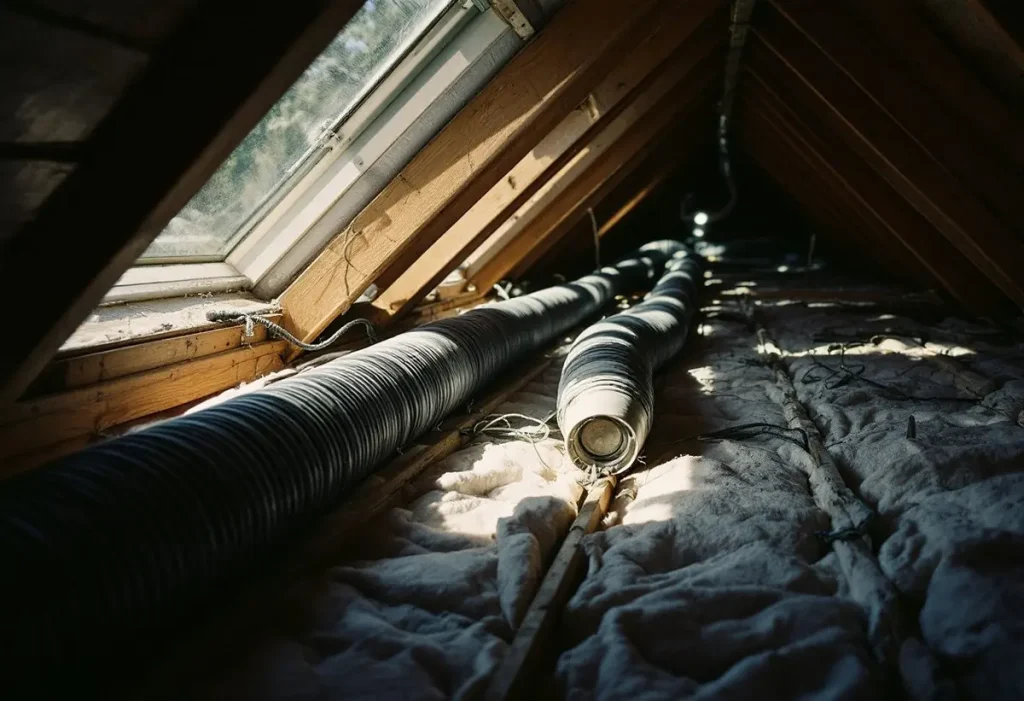
Often more than any row above. LBNL’s Saving Tons at the Register simulated a 4 ton system in a 2,000 square foot Sacramento house on a 97°F design day. With attic ducts, the typical new build delivered 1.55 tons at the registers once the house reached 75°F, 39% of rated. The worst case, 70% charge and 30% duct leakage, delivered 0.68; a tight, fully charged system delivered 2.33. That study models 1990s construction. ENERGY STAR still puts typical duct loss at 20 to 30 percent of the air. A small return does similar damage: what an undersized return does.
What can you change today if the 75 limit is real?
You can cut heat gain and stop losing ground; you cannot buy capacity from the thermostat. York’s table gives the same unit 9% less at 75°F and 62°F wet bulb than at 80°F and 67°F, so a lower setpoint adds run time, not Btu. On a limit day, leaving it on beats restarting: LBNL’s typical case needed 270 minutes to pull a 102°F house to 75°F. DOE Energy Saver credits exterior awnings with up to 77% less solar gain on west windows and cellular shades with up to 60%.
If the first table says your system should hold and all four readings pass, ask for a room by room load calculation, and read the case for insulating first before pricing a larger unit.
Frequently asked questions
Why won’t my house cool below 73?
Because 73 sits 2°F below the 75°F that Manual J assumes, the limit arrives about 3°F earlier in our calculation: 89°F outside in Atlanta, 92°F in Houston, 105°F in Phoenix. York’s 3 ton table also shows less capacity as indoor temperature falls.
Why won’t my house cool below 76?
One degree past design is normal on a hot afternoon. A guide hosted by DOE says a properly sized system may only reach 76°F or 77°F during hours above design. Our limit for 76 is 93°F outside in Atlanta and 96°F in Houston. Below those highs, run the split test.
Why won’t my house cool below 80?
Capacity alone rarely explains 80. A system sized exactly to the load gets there at about 98°F outside in Atlanta, 102°F in Houston and 116°F in Phoenix. At a milder high, suspect a fault: Southern California Edison tests cited by NIST measured a 54% capacity loss at 27% undercharge.
How we researched this
In November 2026 we opened DOE EnergyPlus station files for six airports (ASHRAE 2009 values, TMY3 hours), ENERGY STAR’s 2015 edition county guide, 10 CFR 430 Appendix M, York’s YC3 guide, NIST TN 1848, two LBNL papers and Proctor’s procedure. ACCA Manual J and the ASHRAE Handbook are paywalled and cited only through those restatements. Contractor blogs and study guides were excluded.
Equation: capacity ratio times (1 + 0.0201 per °F of indoor rise) equals (outdoor minus 65 minus rise) divided by (design minus 65). Capacity uses York’s 1,200 CFM 75°F/62°F column, 0.0201 its 95°F row, and 65°F a national rating assumption borrowed for shape. Moving the base 5°F shifts limits under 0.5°F; dropping the 0.0201 term cuts the 80 column 2 to 3°F. Total capacity meets total load here, so Houston’s latent burden is understated.
Sources
- U.S. DOE, EnergyPlus weather data. “Station and TMY3 files with ASHRAE 2009 design values, stations 722780, 722590, 722430, 725650, 722190, 725300 (Phoenix linked).” https://energyplus-weather.s3.amazonaws.com/north_and_central_america_wmo_region_4/USA/AZ/USA_AZ_Phoenix-Sky.Harbor.Intl.AP.722780_TMY3/USA_AZ_Phoenix-Sky.Harbor.Intl.AP.722780_TMY3.stat. Accessed November 2026.
- U.S. EPA, ENERGY STAR. “Design Temperature Limit Reference Guide (2015 Edition).” https://www.energystar.gov/sites/default/files/asset/document/Design%20Temperature%20Limit%20Reference%20Guide%20%282015%20Ed%29%20%2D%20ENERGY%20STAR%20Certified%20Homes_Rev10.pdf. Accessed November 2026.
- John D. Sedine, 2018 ICC Conference. “An Overview on ACCA’s Residential HVAC System Design Process.” https://iccsafe.org/wp-content/uploads/Residential-HVAC-Design-Process.pdf. Accessed November 2026.
- CARB, Steven Winter Associates, hosted by U.S. DOE. “Designing Forced-Air HVAC Systems, last update 8-31-2010.” https://www1.eere.energy.gov/buildings/publications/pdfs/building_america/forced_air_hvac_guide.pdf. Accessed November 2026.
- eCFR. “10 CFR 430 Subpart B, Appendix M, section 4.1.” https://www.ecfr.gov/current/title-10/chapter-II/subchapter-D/part-430/subpart-B/appendix-Appendix%20M%20to%20Subpart%20B%20of%20Part%20430. Accessed November 2026.
- York, Johnson Controls. “Technical Guide: LX Series YC3 Models, Table 11 (distributor mirror).” https://fenton.yorknow.com/pub/media/documentation/yc3_techguide.pdf. Accessed November 2026.
- Proctor Engineering Group. “Temperature Split Airflow Check Procedure.” https://www.proctoreng.com/dnld/Temp_airflow.pdf. Accessed November 2026.
- NIST. “Sensitivity Analysis of Installation Faults on Heat Pump Performance, TN 1848.” https://nvlpubs.nist.gov/nistpubs/TechnicalNotes/NIST.TN.1848.pdf. Accessed November 2026.
- LBNL. “Dirty Air Conditioners, ACEEE Summer Study 2002.” https://www.aceee.org/files/proceedings/2002/data/papers/SS02_Panel1_Paper23.pdf. Accessed November 2026.
- LBNL. “Saving Tons at the Register, LBNL-41957.” https://escholarship.org/uc/item/0vv9w4x5. Accessed November 2026.
- U.S. EPA, ENERGY STAR. “Duct Sealing.” https://www.energystar.gov/saveathome/heating-cooling/duct-sealing. Accessed November 2026.
- U.S. DOE Energy Saver. “Energy Efficient Window Coverings (archived copy).” https://web.archive.org/web/2025id_/https://www.energy.gov/energysaver/energy-efficient-window-coverings. Accessed November 2026.
Leave a Reply