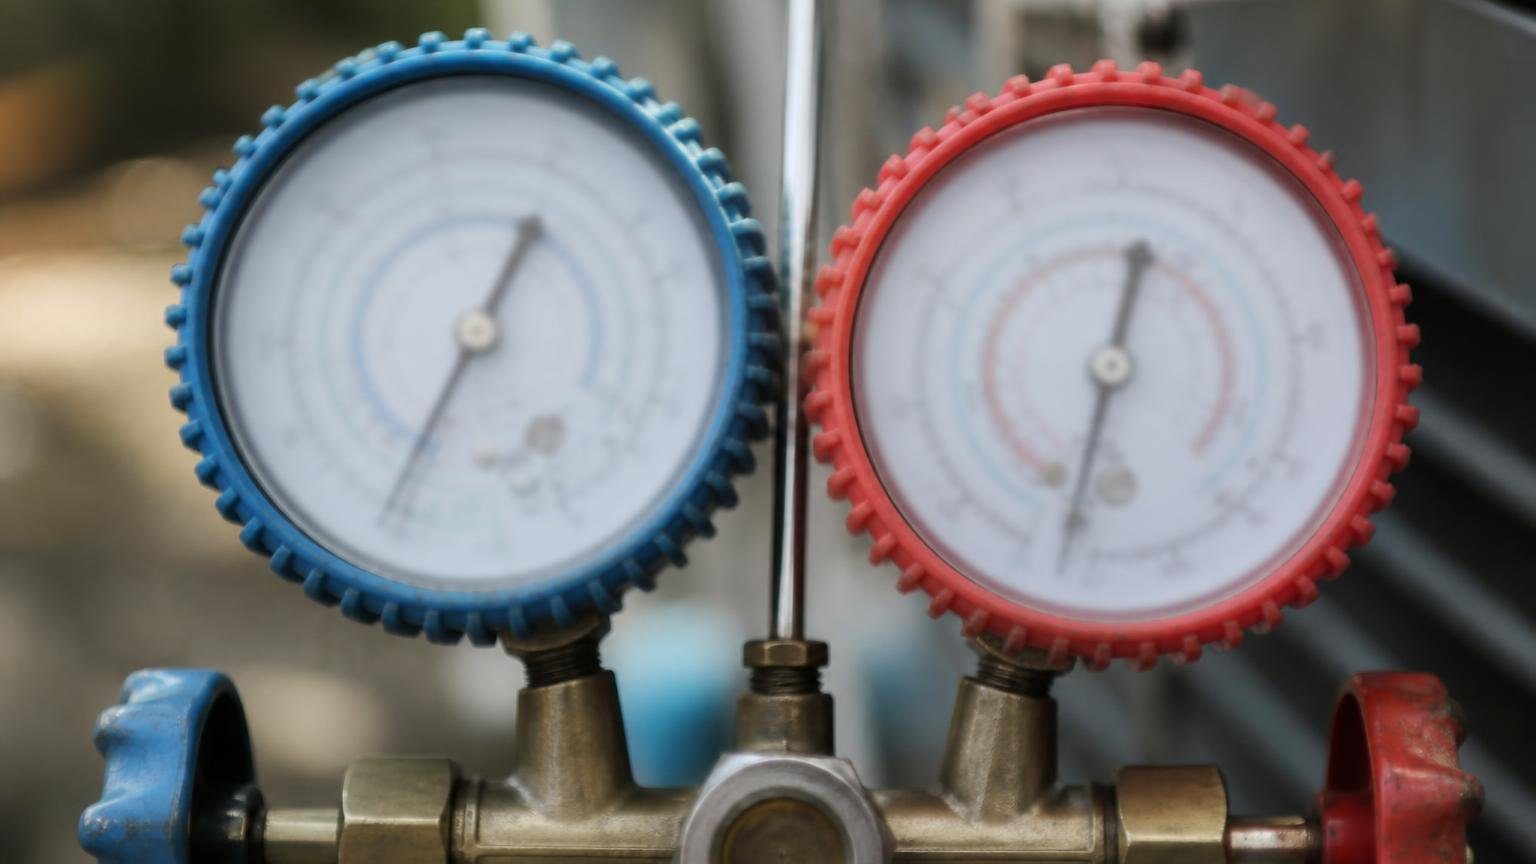
What does an R410a pressure chart show? An R410a pressure chart lists saturation pressure by temperature: 118.8 psig at 40°F and 318.6 psig at 100°F on Arkema’s REFPROP-based chart. R-454B reads lower (107.0 psig dew at 40°F) and R-32 slightly higher (121.0 psig). Pressure alone does not set the charge.
Key Takeaways
- R-410A saturates at 118.8 psig at 40°F and 419.4 psig at 120°F on the Arkema Forane PT chart (2025, NIST REFPROP data).
- R-454B needs two columns: 112.0 psig bubble and 107.0 psig dew at 40°F. The Chemours Opteon XL41 table agrees.
- R-32 runs above R-410A at every row: 429.3 vs 419.4 psig at 120°F on the same Arkema chart.
- Daikin’s 2024 A1 vs. A2L chart prints R-454B up to 3.4 psi above Arkema (399.1 vs 395.7 psig at 120°F); its R-410A and R-32 columns match.
- Goodman: “DO NOT adjust the charge based exclusively on suction pressure” except for a gross undercharge (IOG-4038, 2021).
- Gauge work is certified work: 40 CFR 82.161 requires Type II certification to service medium-, high- and very high-pressure appliances.
R410a pressure chart: R-410A, R-454B and R-32 side by side
This table gives saturation pressure in psig, every 10°F from 0°F to 120°F, for the three residential refrigerants of 2026. Every value is copied from the Arkema Forane chart, whose data “was generated using the NIST REFPROP Database” Version 10.0. We calculated none of them.
| Saturation temp (°F) | R-410A (psig) | R-454B bubble / liquid (psig) | R-454B dew / vapor (psig) | R-32 (psig) |
|---|---|---|---|---|
| 0 | 48.4 | 45.3 | 42.7 | 49.3 |
| 10 | 62.4 | 58.5 | 55.4 | 63.5 |
| 20 | 78.7 | 73.9 | 70.3 | 80.0 |
| 30 | 97.4 | 91.7 | 87.4 | 99.1 |
| 40 | 118.8 | 112.0 | 107.0 | 121.0 |
| 50 | 143.2 | 135.0 | 129.3 | 145.9 |
| 60 | 170.7 | 161.1 | 154.6 | 174.1 |
| 70 | 201.8 | 190.5 | 183.1 | 205.8 |
| 80 | 236.5 | 223.4 | 215.2 | 241.5 |
| 90 | 275.4 | 260.1 | 251.0 | 281.3 |
| 100 | 318.6 | 300.8 | 290.9 | 325.7 |
| 110 | 366.4 | 345.9 | 335.2 | 374.9 |
| 120 | 419.4 | 395.7 | 384.3 | 429.3 |
Source: Arkema, Forane PT chart, PPC/SDC 05-2025. Arkema prints one R-410A column; iGas USA and Daikin list R-410A liquid and vapor 0.2 to 1.1 psi apart in this range.
We spot-checked every column against a second chart. R-410A matches Honeywell’s Genetron AZ-20 chart (120 psig = 40.6°F, 320 psig = 100.4°F, 420 psig = 120.2°F). R-32 matches Daikin’s chart within 0.1 psi at all 13 rows. R-454B matches Chemours to 0.1 psi but not Daikin (see the last section).
How do you read a refrigerant PT chart?
Find the gauge pressure in the correct refrigerant column and read across to the saturation temperature: the temperature at which refrigerant boils or condenses inside the coil, not the pipe temperature. Honeywell’s own worked example converts an R-410A suction reading of 120 psig to “~ 41°F”.
- Confirm the refrigerant on the nameplate. R-410A and R-454B A2L system units can look identical.
- Read the gauge in psig. A manifold gauge set shows low side on the blue gauge and high side on the red.
- Pick the column. R-454B uses dew (vapor) for suction readings and bubble (liquid) for liquid line readings.
- Read across, interpolating between rows: 118.8 psig of R-410A is 40°F.
- Compare saturation with pipe temperature for superheat or subcooling, then with the maker’s target.
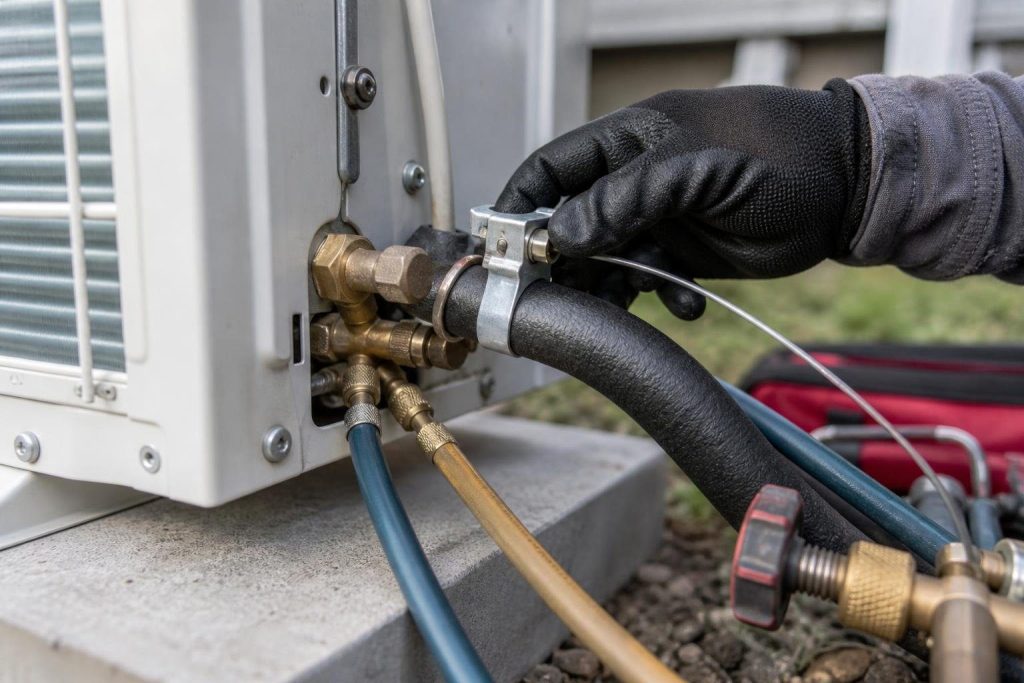
What are normal R410a pressures on the high and low side?
There is no single normal R-410A pressure. The low side follows evaporator saturation temperature and the high side follows condensing temperature; both move with indoor load, airflow and outdoor temperature.
The right number comes from the unit, not a range. Johnson Controls’ R-410A installation manual (form 1183509-UIM-F-0116) finds “the recommended liquid pressure” on the unit’s charging chart at the intersection of indoor wet bulb and outdoor dry bulb. Its example: chart 320 psig, gauge 305 psig, so refrigerant is added.
Worked example: an R-410A system on a 90°F afternoon
Say the gauges read 118.8 psig low side and 320 psig high side. That is 40°F saturated suction and, on Honeywell’s chart, 100.4°F saturated condensing. Those temperatures, not the raw pressures, are what the charging chart and the supply and return temperature split are judged against. The readings are illustrative; the conversions are chart values.
There is a hard floor: Goodman warns that operating “at suction pressures less than 20 psig for more than 5 seconds” permanently damages the scrolls.
Correction: two pressure ranges that fail the chart
Scraped “chart” pages crowding this search say the R-410A high side runs 102 to 145 psig. On the table, 97.4 to 143.2 psig is 30°F to 50°F saturated: low side territory.
A ranking supplier blog says 370 to 420 psi on a 70°F day. Honeywell puts 370 psig at 110.8°F and 420 psig at 120.2°F, a condenser 41°F to 50°F above the outdoor air. Check such readings against the unit’s charging chart.
Why does the R454b pressure chart have dew and bubble columns?
An R454b pressure chart has two columns because R-454B is a zeotropic blend: at one pressure it starts boiling (bubble point) and finishes (dew point) at different temperatures. Daikin’s chart lists the blend as R-32 (68.9%) and R-1234yf (31.1%). R-410A, a 50/50 mix of R-32 and R-125, splits by only 0.4 psi at 40°F.
On the Arkema chart the R-454B gap is 5.0 psi at 40°F (112.0 bubble vs 107.0 dew) and 11.4 psi at 120°F (395.7 vs 384.3). Writing in ACHR News in 2019, Bryan Orr put the rule plainly: “We use the bubble point to calculate subcooling,” and the dew point for superheat. The superheat and subcooling worked examples carry that rule through the arithmetic.
Reading R-454B on an R-410A chart is a real error. An R-454B coil at 40°F dew shows 107.0 psig; on the R-410A column, 107.7 psig is 35°F. The wrong chart invents about 5°F of superheat, which can prompt an unneeded charge.
How do R-410A, R-454B and R-32 pressures compare?
R-32 runs highest, R-410A close behind and R-454B lowest at every temperature on the chart. At 100°F, R-32 saturates at 325.7 psig, R-410A at 318.6 psig and R-454B at 300.8 psig bubble.
Pressure is why parts are refrigerant-rated. Honeywell says R-410A runs “about 60% (1.6 times) greater than R-22” and calls for filter driers rated to at least 600 psig, one reason an R-22 system cannot take R-410A. Daikin adds that under current EPA SNAP approvals, A2L refrigerants “can only be used in new equipment” and cannot be retrofitted into an existing system.
So an existing R-410A unit is serviced with R-410A; the rules on installing R-410A in 2026 govern new installs. New A2L equipment runs R-454B or R-32, a single-component refrigerant, and each needs its own column.
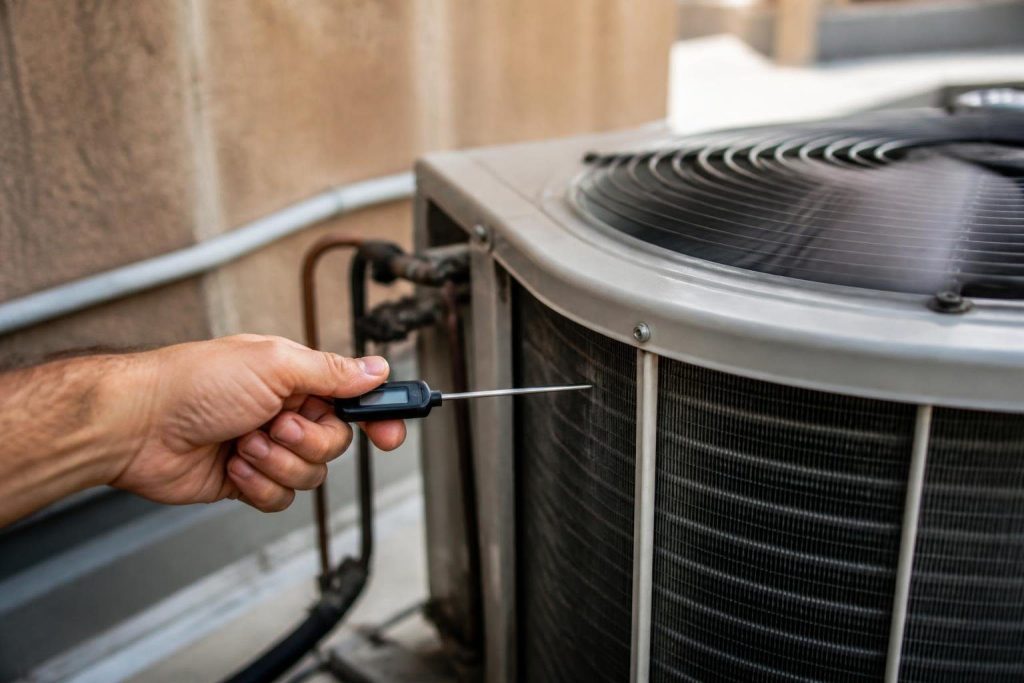
Can a pressure chart tell you if the charge is right?
No. A pressure chart converts a reading into a saturation temperature; it cannot say whether the charge is right. Goodman’s IOG-4038 is blunt: “DO NOT adjust the charge based exclusively on suction pressure unless for general charging in the case of a gross undercharge.” It also requires 60°F or higher outdoors before checking charge.
Goodman checks charge by superheat with a piston and subcooling with a TXV, against the target on the unit. A low reading on a system that once worked usually points to a leak, which is why a sealed AC should not need a recharge and why finding the leak comes before adding refrigerant.
Gauges also open the circuit. Under 40 CFR 82.161, any person “who could be reasonably expected to violate the integrity of the refrigerant circuit” must pass an approved exam, and Type II covers high-pressure appliances. Our EPA 608 certification guide explains the types. Homeowners should read this chart, not act on it.
Why do two PT charts sometimes disagree?
Charts can differ in property data or carry typos. Daikin’s 2024 chart, with values credited to Weitron, prints R-454B above Arkema at every row we checked; Chemours’ REFPROP table matches Arkema to 0.1 psi.
| Saturation temp | Arkema R-454B bubble / dew (psig) | Daikin R-454B bubble / dew (psig) | Largest gap |
|---|---|---|---|
| 0°F | 45.3 / 42.7 | 46.1 / 43.3 | 0.8 psi |
| 40°F | 112.0 / 107.0 | 113.3 / 107.7 | 1.3 psi |
| 100°F | 300.8 / 290.9 | 303.6 / 291.6 | 2.8 psi |
| 120°F | 395.7 / 384.3 | 399.1 / 385.8 | 3.4 psi |
In temperature the gap is small: Arkema’s bubble column rises about 2.1 psi per °F near 40°F (101.5 psig at 35°F) and 5 psi per °F near 120°F, so both gaps are under 1°F. Neither maker explains it and we could not confirm the cause; use the equipment maker’s chart.
Older charts carry plain errors. Bonneville Power Administration’s 2012 R-410A chart, still ranking, lists 20 psig as -36.9°F, between 18 psig at -29.4°F and 22 psig at -24.5°F. The iGas USA chart, ranked first, matches Arkema but names no data source.
How we researched this
Researched October 13, 2026. We consulted 16 sources and cite 10. Every table value is copied from Arkema’s REFPROP-based chart and spot-checked against Honeywell (R-410A), Chemours (R-454B, psia minus 14.696) and Daikin (all three). Charging guidance comes from Goodman and Johnson Controls manuals, Tier 2 but primary for their own equipment.
Excluded: unsourced operating ranges from blogs and scraped chart pages, two ranking pages that blocked our tools, and Reddit (refrigerant handling topic).
Frequently asked questions
What should my 410A pressure be on a 90 degree day?
There is no fixed number. Johnson Controls reads the recommended liquid pressure off the unit’s charging chart, at the intersection of indoor wet bulb and outdoor dry bulb. Its example target is 320 psig, which Honeywell’s R-410A chart converts to 100.4°F saturated condensing. The low side depends on indoor load and airflow.
What are normal operating pressures for 410A?
Normal depends on conditions, so read pressures as saturation temperatures. Honeywell’s worked example has an R-410A evaporator at 120 psig, about 41°F. The high side tracks outdoor temperature and the unit’s charging chart. Goodman warns that suction below 20 psig for more than 5 seconds damages the scroll compressor.
What temperature should a suction line be on R-410A?
Suction line temperature equals saturated suction temperature plus the superheat the manufacturer targets. In Honeywell’s worked example, 120 psig gives a saturation of about 40°F and a 50°F line reading, so superheat is 10°F. Fixed orifice systems use a target superheat chart; TXV systems are charged by subcooling.
How do R454B and R410A pressures differ?
R-454B runs lower. On the Arkema chart, R-454B dew pressure at 40°F is 107.0 psig against 118.8 psig for R-410A, and its bubble pressure at 100°F is 300.8 psig against 318.6 psig. Reading R-454B on an R-410A column misstates saturation by about 5°F at the evaporator.
Is R-32 pressure higher than R-410A?
Slightly. Arkema lists R-32 at 121.0 psig and R-410A at 118.8 psig at 40°F, and 325.7 against 318.6 psig at 100°F. Daikin’s 2024 chart matches both columns within 0.1 psi. R-32 is a single-component refrigerant, so its chart has one column.
Should I use dew or bubble point on an R-454B PT chart?
Use the dew point column for suction pressure and superheat, and the bubble point column for liquid line pressure and subcooling. Bryan Orr stated the rule in ACHR News in 2019. At 40°F the Arkema chart lists 107.0 psig dew and 112.0 psig bubble, a 5.0 psi gap.
Sources
- Arkema. “Forane Refrigerants Pressure Temperature Chart,” PPC/SDC 05-2025. https://forane.arkema.com/files/live/sites/shared_arkema/files/downloads/fluorochemicals/Forane%20Ref%20PT%20Regular%20Chart%20EN. Accessed October 2026.
- Daikin Comfort Technologies North America. “A1 vs. A2L Pressure Temperature Chart, USA,” PM-A2LPTC-USA_04-24 (Chadwell Supply copy). https://www.chadwellsupply.com/globalassets/articles-pk/a2l/a2lptc-usa_04-24.pdf. Accessed October 2026.
- Chemours. “Thermodynamic Properties of Opteon XL41 (R-454B).” https://opteon.com/es/-/media/files/opteon/opteon-xl41-thermo-properties-eng-031522.pdf?rev=-1. Accessed October 2026.
- Honeywell. “PT Chart for Genetron AZ-20 (R-410A),” 2019. https://prod-edam.honeywell.com/content/dam/honeywell-edam/pmt/oneam/en-us/refrigerants/documents/pmt-am-genetron-aZ20-pressure-temp-chart-tech-tool1.pdf. Accessed October 2026.
- Goodman. “Condensing Unit Heat Pump Installation and Service Reference,” IOG-4038, 2021. https://www.budgetheating.com/content/files/downloadables/gszb4%20installation%20manual.pdf. Accessed October 2026.
- Johnson Controls. “R-410A Outdoor Split-System Air Conditioning Installation Manual,” 1183509-UIM-F-0116 (InspectAPedia copy). https://inspectapedia.com/aircond/Thermopride-Split-System-AC-Installation.pdf. Accessed October 2026.
- ACHR News. Bryan Orr, “An Introduction to Glide at Static Pressure,” 2019. https://achrnews.com/articles/141877-an-introduction-to-glide-at-static-pressure. Accessed October 2026.
- eCFR. “40 CFR 82.161 Technician certification.” https://www.ecfr.gov/current/title-40/chapter-I/subchapter-C/part-82/subpart-F/section-82.161. Accessed October 2026.
- Bonneville Power Administration. “R-410A Pressure-temperature chart,” 2012. https://www.bpa.gov/-/media/Aep/energy-efficiency/residential/residential-ptcs-essentials/r-410a-pressure-temperature-chart.pdf. Accessed October 2026.
- iGas USA. “R410A Pressure-Temperature Chart.” https://www.igasusa.com/files/R410A-PT-Chart.pdf. Accessed October 2026.
Leave a Reply