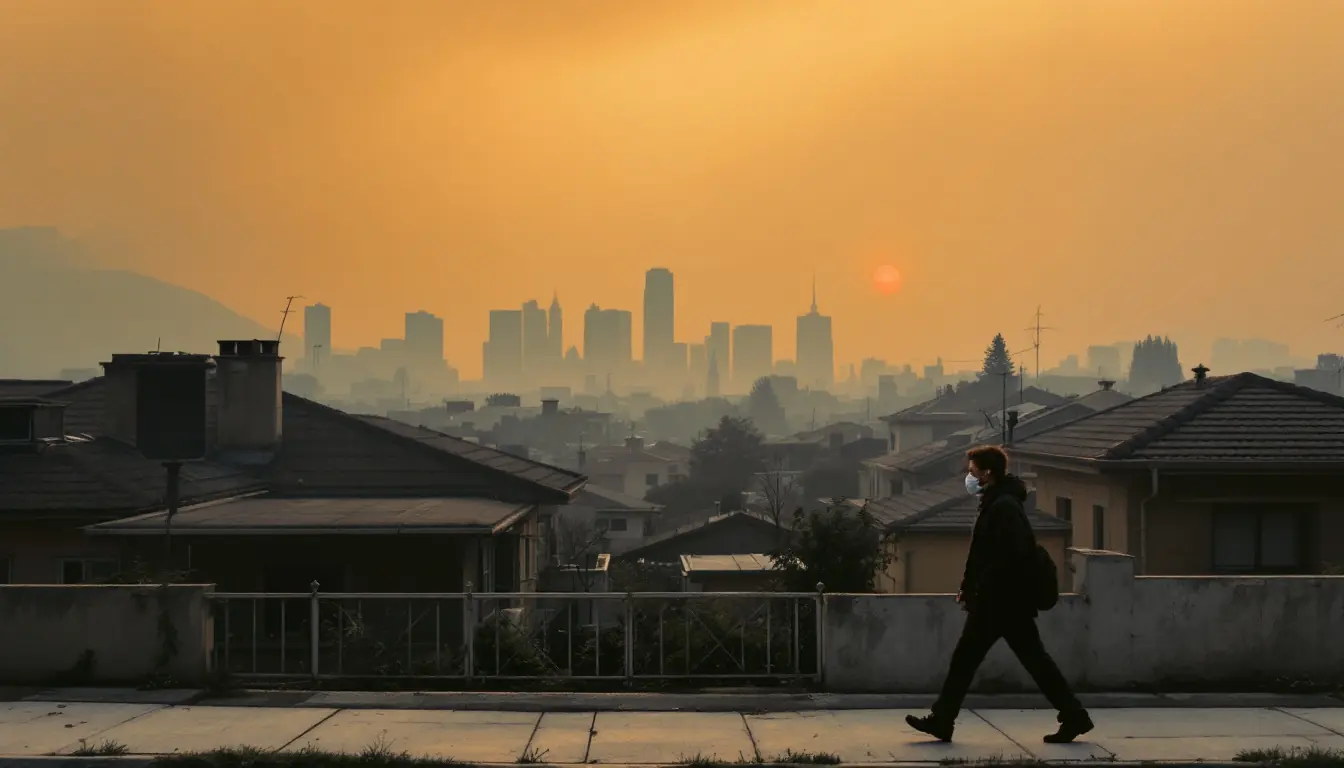
This report measures unhealthy air from fine particles (PM2.5), the pollutant in wildfire smoke, in every US county with an air monitor from 2000 to 2025, using the Environmental Protection Agency’s daily Air Quality Index (AQI) records. It counts days when PM2.5 pushed the AQI above 100 (unhealthy for sensitive groups) and above 150 (unhealthy for everyone), and separates the May to October wildfire season from the rest of the year. Smoke days are when homes rely on their HVAC system and filters to keep indoor air cleaner than outdoor air; see running a window AC during wildfire smoke and MERV ratings and airflow.
Last reviewed: November 2026 · By the HVAC Brief Editorial Team · Our sourcing and editorial standards
The headline is a reversal. Summer fine-particle pollution fell sharply in the 2000s as power plant emissions were cut, and then smoke wiped out the gains. In 2023, 114.6 million Americans lived in a county that had at least one wildfire-season day with PM2.5 AQI above 150, the most in the 26-year record.
Executive summary
Across about 750 monitored counties, wildfire-season (May to October) county-days with PM2.5 AQI above 100 averaged 719 a year in 2000 to 2004, fell to 286 a year in 2009 to 2016, and then averaged 1,416 a year in 2020 to 2025, with peaks of 2,075 in 2020, 1,987 in 2021 and 2,073 in 2023. Days above AQI 150, unhealthy for everyone, went from 29 in 2016 to 1,281 in 2020.
Cold-season PM2.5 pollution, from wood stoves, traffic and winter inversions, kept falling throughout: 1,397 unhealthy county-days in 2000 and 241 in 2025. As a result, the share of unhealthy PM2.5 days falling in May to October rose from 39 percent in 2000 to 2004 to 77 percent in 2020 to 2025. Bad particle-pollution days are now mostly smoke-season days.
The geography has moved. In 2020 the worst-hit states were California, Oregon and Washington. In 2023, Canadian wildfire smoke made Pennsylvania, Wisconsin, New York and Ohio among the states with the most days above AQI 150. Over 2021 to 2025, North Dakota averaged 8.2 unhealthy smoke-season days per monitored county a year, against 0.06 in 2000 to 2004.
Population exposure peaked in 2023: 114.6 million people lived in counties that recorded at least one wildfire-season day above AQI 150, and 170.5 million in counties with at least one day above 100. On June 7, 2023, the daily AQI reached 278 in Queens and 249 in Brooklyn, the highest daily AQI for any pollutant in any New York City county in EPA’s records since 2000.
Key findings
- Wildfire-season unhealthy PM2.5 county-days (AQI over 100): 719 a year in 2000-2004, 286 in 2009-2016, 1,416 in 2020-2025 (EPA AirData, HVAC Brief analysis).
- Wildfire-season days above AQI 150: 29 county-days in 2016, 1,281 in 2020, 964 in 2023.
- Cold-season unhealthy PM2.5 county-days fell from 1,397 (2000) to 241 (2025).
- Share of unhealthy PM2.5 days in May to October: 39 percent (2000-2004) to 77 percent (2020-2025).
- Most people exposed: 2023, 114.6 million in counties with a season day above AQI 150.
- Hazardous days (AQI over 300) from PM2.5: 195 county-days in 2020; no more than 10 in any year from 2000 to 2016.
- Highest 2021-2025 average: North Dakota, 8.2 unhealthy smoke-season days per monitored county a year.
- Largest increase since 2000-2004: North Dakota.
- New York City daily AQI, June 7, 2023: Queens 278, Brooklyn 249, Manhattan 208.
- Highest daily county readings were in California, Oregon, Washington and Montana in 2017, 2020 and 2021, several above 1,000 on EPA’s extended scale.
How smoke days are measured here
EPA’s AirData daily AQI files report, for every county with a monitor, the day’s highest AQI and the pollutant that set it. This report counts county-days when PM2.5 was the defining pollutant and the AQI exceeded 100 or 150. PM2.5 comes from many sources, so to approximate smoke we separate the May to October wildfire season, when smoke dominates high PM2.5 readings in most of the country, from November to April, when wood heating and winter inversions do. EPA does not label days as smoke days in these files, so season is a proxy, not an attribution. The daily AQI is based on a 24-hour average, so it is lower than the hourly peaks reported during smoke events.
Unhealthy smoke-season air, 2000 to 2025
Source: EPA AirData daily AQI by county; HVAC Brief analysis. About 740 to 800 counties monitored PM2.5 each year.
| Year | May-Oct days over 100 | May-Oct days over 150 | Nov-Apr days over 100 | Share in May-Oct | Population in counties with a May-Oct day over 150 |
|---|---|---|---|---|---|
| 2000 | 786 | 85 | 1,397 | 36% | 45.5 million |
| 2001 | 698 | 91 | 1,453 | 32% | 42.3 million |
| 2002 | 722 | 166 | 1,053 | 41% | 66.0 million |
| 2003 | 723 | 85 | 864 | 46% | 42.9 million |
| 2004 | 668 | 63 | 974 | 41% | 27.8 million |
| 2005 | 1,099 | 60 | 1,258 | 47% | 31.4 million |
| 2006 | 649 | 72 | 754 | 46% | 42.0 million |
| 2007 | 1,050 | 161 | 1,152 | 48% | 50.3 million |
| 2008 | 468 | 115 | 801 | 37% | 15.6 million |
| 2009 | 152 | 36 | 942 | 14% | 18.6 million |
| 2010 | 191 | 32 | 863 | 18% | 25.0 million |
| 2011 | 325 | 48 | 917 | 26% | 25.6 million |
| 2012 | 409 | 195 | 572 | 42% | 20.9 million |
| 2013 | 190 | 86 | 1,237 | 13% | 18.7 million |
| 2014 | 176 | 43 | 834 | 17% | 15.7 million |
| 2015 | 743 | 289 | 597 | 55% | 33.6 million |
| 2016 | 105 | 29 | 623 | 14% | 14.9 million |
| 2017 | 1,170 | 527 | 702 | 62% | 30.1 million |
| 2018 | 1,128 | 460 | 689 | 62% | 31.6 million |
| 2019 | 110 | 40 | 350 | 24% | 18.0 million |
| 2020 | 2,075 | 1,281 | 345 | 86% | 74.9 million |
| 2021 | 1,987 | 830 | 421 | 83% | 53.1 million |
| 2022 | 675 | 318 | 418 | 62% | 28.8 million |
| 2023 | 2,073 | 964 | 293 | 88% | 114.6 million |
| 2024 | 681 | 222 | 362 | 65% | 29.2 million |
| 2025 | 1,006 | 333 | 241 | 81% | 46.8 million |
The table tells two stories. Winter particle pollution fell steadily as emissions from wood heating, diesel engines and power plants declined, from 1,397 unhealthy county-days to about 250 to 400 a year in the 2020s. Summer pollution fell too, to a low of 105 county-days in 2016, then reversed with the large fire seasons of 2017, 2018, 2020, 2021 and 2023. Quieter fire years such as 2016, 2019 and 2022 show how much the totals depend on each year’s fires.
Smoke days by state
| State | 2021-2025 average | 2000-2004 average | Days over 150, 2021-2025 (all counties) | Monitored counties |
|---|---|---|---|---|
| North Dakota | 8.2 | 0.06 | 148 | 9 |
| Oregon | 5.4 | 0.62 | 334 | 22 |
| Idaho | 4.9 | 0.66 | 184 | 20 |
| Montana | 4.5 | 0.90 | 145 | 22 |
| Minnesota | 4.3 | 0.51 | 167 | 19 |
| Nevada | 4.0 | 0.28 | 85 | 6 |
| Wisconsin | 3.4 | 0.31 | 120 | 17 |
| California | 3.0 | 1.38 | 434 | 49 |
| Washington | 3.0 | 0.31 | 253 | 31 |
| South Dakota | 2.6 | 0.03 | 46 | 9 |
| Michigan | 2.2 | 0.85 | 64 | 17 |
| Connecticut | 1.7 | 1.20 | 19 | 5 |
| New York | 1.7 | 1.51 | 65 | 18 |
| Delaware | 1.5 | 2.07 | 10 | 3 |
| Iowa | 1.5 | 0.24 | 43 | 13 |
| Ohio | 1.5 | 3.36 | 61 | 24 |
| Illinois | 1.4 | 0.91 | 51 | 17 |
| Pennsylvania | 1.4 | 3.40 | 102 | 32 |
| Alaska | 1.3 | 0.68 | 35 | 8 |
| Indiana | 1.3 | 1.24 | 40 | 22 |
Source: EPA AirData; HVAC Brief analysis. States with at least three monitored counties.
North Dakota, which barely registered in the early 2000s, leads the 2021 to 2025 period, driven by smoke from Canadian fires in 2021 and 2023. The Pacific Northwest and northern Rockies follow. California ranks lower per county than its reputation suggests, because it has many monitored counties and some, along the coast, see fewer smoke days, but it recorded the most total days above AQI 150.
The worst years by region
| Year | State | Monitored counties | Days over 100 | Days over 150 |
|---|---|---|---|---|
| 2020 | California | 51 | 975 | 628 |
| 2020 | Washington | 31 | 252 | 212 |
| 2020 | Oregon | 23 | 255 | 211 |
| 2020 | Idaho | 20 | 142 | 84 |
| 2020 | Montana | 19 | 90 | 48 |
| 2023 | Pennsylvania | 32 | 154 | 96 |
| 2023 | Oregon | 21 | 124 | 75 |
| 2023 | Wisconsin | 19 | 129 | 60 |
| 2023 | New York | 18 | 97 | 59 |
| 2023 | Ohio | 23 | 136 | 58 |
2020’s season was a West Coast event: California alone had 628 county-days above AQI 150. In 2023 the smoke came from Canada and settled over the Northeast and Midwest, regions with large populations and, in the Northeast, the country’s highest share of school buildings without air conditioning. That is why 2023 has the highest population exposure even though 2020 had more severe days.
| County | Daily AQI, June 7, 2023 |
|---|---|
| Queens | 278 |
| Bronx | 253 |
| Kings (Brooklyn) | 249 |
| New York (Manhattan) | 208 |
The highest readings on record
| State | County | Date | Daily AQI |
|---|---|---|---|
| California | Mono | 2020-09-17 | 1493 |
| California | Mono | 2020-09-14 | 1458 |
| Washington | Klickitat | 2020-09-12 | 1358 |
| California | Mono | 2020-09-16 | 1300 |
| Oregon | Marion | 2020-09-11 | 1272 |
| Washington | Klickitat | 2020-09-11 | 1220 |
| California | Trinity | 2021-08-07 | 1217 |
| Washington | Klickitat | 2020-09-13 | 1196 |
| California | Mono | 2020-09-15 | 1166 |
| Oregon | Jefferson | 2020-09-12 | 1135 |
| Montana | Missoula | 2017-09-06 | 1130 |
| California | Trinity | 2021-08-06 | 1111 |
The AQI scale is defined up to 500. EPA’s daily files report higher values by extending the formula, and readings above 1,000 occurred near the 2017 Montana fires, the September 2020 West Coast fires and the 2021 Northern California fires. A single monitor close to a fire can record extreme values that do not represent a whole county.
Original synthesis (HVAC Brief calculations)
1. Smoke has undone two decades of summer clean-air progress
Wildfire-season unhealthy PM2.5 days fell by about 60 percent between 2000-2004 and 2009-2016, a period that coincided with large cuts in power plant sulfur dioxide, which forms summer sulfate particles in the East. They then rose to 2.0 times the early-2000s level in 2020 to 2025. Days above AQI 150, which require stronger action for everyone, were 7 times as common in 2020-2025 as in 2000-2004.
2. Bad air days have moved from winter to summer
In 2000 to 2004, 39 percent of unhealthy PM2.5 days fell in May to October; in 2020 to 2025, 77 percent did. For HVAC this changes when filtration matters. Air cleaning used to be a winter concern in valleys with wood smoke; it is now a summer one, when homes run air conditioning and can recirculate and filter indoor air, provided the system has a filter capable of capturing fine particles.
3. The smoke map now includes the Northeast and Midwest
In 2020, the five states with the most smoke-season days above AQI 150 were all in the West. In 2023, Pennsylvania, Wisconsin, New York and Ohio were among the top five. The Northeast has older housing and, in our analysis of school buildings, the highest share of buildings without air conditioning. A home with a central system can close windows, run the fan and filter; a home without one has fewer options.
4. What the numbers mean indoors
EPA’s guidance for smoke events is to stay indoors, keep windows closed, and filter indoor air with a central system filter of MERV 13 or higher or a portable air cleaner. The data here show how often that guidance applies: in a bad year, more than a hundred million people live in a county that has at least one day when the air is unhealthy for everyone. Most homes were not set up for that; see our guides to HVAC filters and indoor air quality monitors.
Charts worth building from this data
- Stacked area chart of unhealthy PM2.5 county-days by season, 2000 to 2025.
- Small-multiple maps of counties with days above AQI 150 in 2020 and 2023.
- Bar chart of population in counties with a season day above AQI 150, by year.
- Slope chart of state smoke-season days per county, 2000-2004 vs 2021-2025.
- Calendar heat map of daily AQI in New York City, June 2023.
Most quotable statistics
- In 2023, 114.6 million Americans lived in a county that had at least one wildfire-season day with unhealthy air for everyone (AQI over 150), the most since at least 2000 (EPA data, HVAC Brief analysis).
- US counties recorded 1,281 smoke-season days above AQI 150 in 2020, against 29 in 2016.
- 77 percent of unhealthy fine-particle pollution days now fall in May to October, up from 39 percent in the early 2000s.
- North Dakota went from almost no smoke-season unhealthy air days in 2000-2004 to 8.2 per monitored county a year in 2021-2025.
- Queens recorded a daily AQI of 278 on June 7, 2023, during the Canadian wildfire smoke event.
- Winter particle pollution days fell by about 80 percent since 2000; summer smoke days rose.
Data limitations
- EPA daily county files report the highest AQI among the county’s monitors; county-days measure monitored counties, about 750 a year, not all 3,100 counties.
- Season is a proxy for smoke. Some May-October PM2.5 days come from other sources, and some November-April days (for example the December 2017 Southern California fires) are smoke.
- Population exposure counts everyone in a county with at least one qualifying day; it does not mean every resident experienced unhealthy air.
- The number of monitored counties varies slightly by year; per-county rates control for this at state level.
- Daily AQI uses 24-hour averages; hourly peaks are higher.
- 2025 values reflect EPA data as downloaded in November 2026 and may be revised as monitoring data are certified.
Downloadable dataset: recommended fields
| Field | Description |
|---|---|
| date | Calendar date |
| state / county | Location |
| fips | State and county FIPS |
| aqi | Daily AQI |
| defining_parameter | Pollutant setting the AQI |
| season | May-Oct or Nov-Apr |
| county_population | Census population estimate for the year |
| over_100 / over_150 / over_300 | AQI threshold flags |
Press summary
Wildfire smoke has reversed two decades of progress on summer air pollution, according to an HVAC Brief analysis of 26 years of EPA air quality records. Unhealthy fine-particle days in the May to October wildfire season fell by about 60 percent between the early 2000s and the mid-2010s, then returned at 2.0 times the early-2000s level in 2020 to 2025. In 2023, when Canadian smoke covered the Northeast and Midwest, 114.6 million Americans lived in a county that had at least one day when the air was unhealthy for everyone.
Suggested headlines
- Wildfire smoke has erased 20 years of summer clean-air gains
- 114.6 million Americans lived through unhealthy smoke days in 2023
- Bad air days have moved from winter to summer
- North Dakota now has more smoke days than California, per county
- Smoke season is coming for the Northeast’s un-air-conditioned buildings
Source quality ranking
| Source | Tier | Why |
|---|---|---|
| EPA AirData, daily AQI by county, 2000 to 2025 | Tier 1 | Federal regulatory monitoring network |
| Census Bureau county population estimates | Tier 1 | Official denominators |
| Low-cost sensor networks | Not used | Uncalibrated; not comparable over 26 years |
Methodology
- Source: EPA AirData pre-generated files daily_aqi_by_county_YYYY.zip, 2000 to 2025, downloaded November 2026. Puerto Rico, the Virgin Islands and Mexican border counties excluded.
- A county-day counts when Defining Parameter is PM2.5 and AQI exceeds 100 (or 150, or 300). May to October is the wildfire-season window; November to April is the cold season.
- Monitored counties = counties with at least one PM2.5-defined day in the year. State per-county rates = state county-days / monitored counties, averaged over years.
- Population: Census county estimates (2010-2020 and 2020-2025 vintages); years before 2010 use 2010 estimates.
- Records above 500 are as reported by EPA on its extended scale.
Frequently asked questions
How many days of unhealthy air from wildfire smoke are there in the US?
In 2020 to 2025, monitored US counties averaged 1,416 county-days a year with fine-particle AQI above 100 during the May to October fire season, peaking at about 2,000 in 2020, 2021 and 2023 (EPA data).
Is wildfire smoke getting worse?
Yes. Smoke-season unhealthy days in 2020 to 2025 were 2.0 times the 2000-2004 level and about 5 times the 2009-2016 level.
Which state has the most wildfire smoke days?
Per monitored county over 2021 to 2025, North Dakota, followed by Oregon and Idaho. California had the most total days above AQI 150.
What was the worst year for wildfire smoke?
By severity, 2020, with 1,281 county-days above AQI 150. By people exposed, 2023, when 114.6 million lived in counties with at least one such day.
How bad was the 2023 Canadian smoke in New York?
The daily AQI on June 7, 2023 reached 278 in Queens and 249 in Brooklyn; hourly readings were higher.
What AQI is unhealthy?
Above 100 is unhealthy for sensitive groups, above 150 unhealthy for everyone, above 200 very unhealthy and above 300 hazardous.
Does central air conditioning help with wildfire smoke?
It can, if windows stay closed, the system recirculates indoor air and it has a high-efficiency filter. EPA recommends MERV 13 or higher where the system can handle it, or a portable air cleaner.
What MERV filter is best for smoke?
MERV 13 or higher captures most fine particles. Check that your system can handle the extra resistance; see our MERV guide.
Has air pollution in the US gotten better?
In winter, yes: unhealthy fine-particle days outside the fire season fell from 1,397 county-days in 2000 to 241 in 2025. Summer smoke has offset much of the improvement.
Where does this data come from?
EPA’s AirData daily AQI summaries by county, built from the federal, state and tribal regulatory monitoring network.
Cite this report
Sources
- US EPA, AirData pre-generated files: daily AQI by county, 2000 to 2025.
- EPA AirNow, AQI basics and category definitions.
- EPA, Wildfires and Indoor Air Quality.
- US Census Bureau, county population estimates, 2010-2020 and 2020-2025 vintages.
The HVAC Brief is an independent trade publication. We do not sell equipment, take manufacturer advertising, or accept payment for placement in our research. Corrections welcome.
Leave a Reply