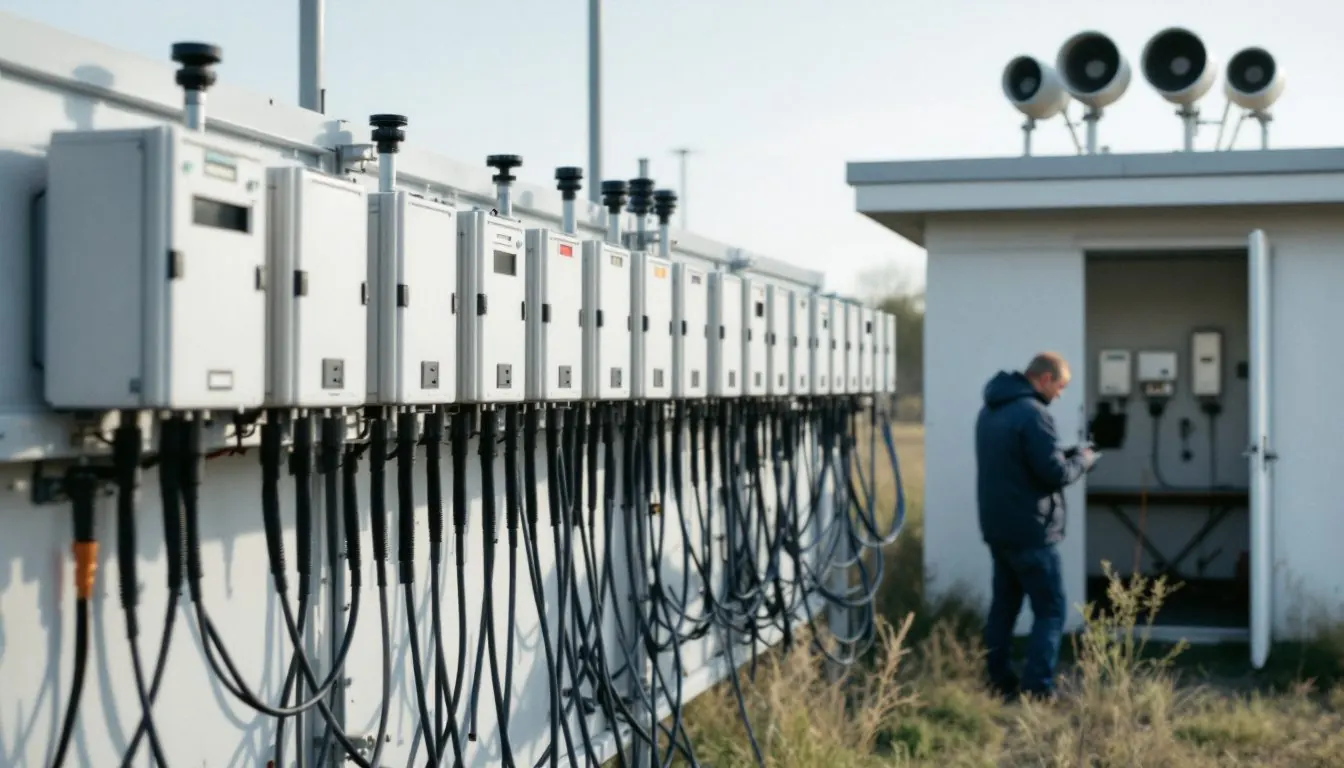
Is an indoor air quality monitor accurate? Partly. In independent tests, PM2.5 and NDIR carbon dioxide readings often track reality well enough to act on, while TVOC and estimated CO2 numbers do not. No indoor air quality monitor replaces a UL 2034 carbon monoxide alarm or a radon test.
Key Takeaways
- In AQ-SPEC field tests, PM2.5 correlation (R²) ran from 0.97 to 0.98 for the AirGradient Open Air down to 0.44 to 0.49 for the Airthings Space Pro (AQ-SPEC summary table).
- EPA’s 2021 targets for outdoor PM2.5 sensors call for R² ≥ 0.70 and an error of no more than 7 µg/m³ (EPA/600/R-20/280).
- EPA says there are currently no widely accepted indoor performance criteria for most low-cost monitors (EPA indoor air guidance).
- In a 2021 chamber study of eight consumer monitors, most under-reported particles by up to 50% but read CO2 within 15% (Demanega et al., Building and Environment).
- LBNL found little or no response to particles smaller than 0.25 µm, such as steady candle flames (Wang, Delp and Singer, 2020).
- No federally enforceable standards exist for VOCs in non-industrial settings (EPA).
What does an indoor air quality monitor measure?
An indoor air quality monitor is a box of low-cost sensors that estimates a few pollutants and comfort conditions, not the whole air. EPA lists the usual targets as particulate matter, radon, carbon monoxide, carbon dioxide, formaldehyde, VOCs, temperature and humidity.
The sensor type decides how much a number means. Particles are read by optical light scattering, CO2 by non-dispersive infrared (NDIR) cells in better units, and VOCs by metal oxide (MOS) chips. EPA notes that alert thresholds are set by each manufacturer.
| Reading | Typical sensor | What independent testing found | Source |
|---|---|---|---|
| PM2.5 | Optical light scattering | Field R² from 0 to 0.98 across monitors; chamber tests show under-reporting by up to 50% | AQ-SPEC; Demanega 2021 |
| PM10 | Optical light scattering | Weaker than PM2.5: Airthings Space Pro 0.15 to 0.16; PurpleAir PA-II (2026) 0.10 to 0.11 | AQ-SPEC |
| CO2 (measured) | NDIR | Most monitors within 15% of reference in a chamber | Demanega 2021 |
| CO2 (estimated, eCO2) | Algorithm from a VOC chip | “Substantial errors” when CO2 is estimated from TVOC | Demanega 2021 |
| TVOC | Metal oxide (MOS) | Poor quantitative agreement; Sensirion SGP40 lab R² 0.91 on a low ramp, 0.01 on a high ramp | Demanega 2021; AQ-SPEC |
| Temperature and humidity | Digital chip | Most units within ±0.6 °C and ±5% RH | Demanega 2021 |
| Radon | Alpha detection | No federal accuracy target in these tests; EPA action level is 4 pCi/L | EPA |
How accurate are indoor air quality monitors for PM2.5?
For fine particles, accuracy depends heavily on the model. South Coast AQMD’s AQ-SPEC program runs sensors beside federal reference or equivalent instruments, and its summary table shows PM2.5 field R² from 0 for a 2017 uHoo to 0.97 to 0.98 for the AirGradient Open Air O-1PST.
R² measures how well a sensor rises and falls with the reference; AQ-SPEC says a value approaching 1 is a near perfect correlation. Mean absolute error (MAE) is the size of the miss in µg/m³. A monitor can track trends and still read high.
| Make (model) | PM2.5 field R² | PM2.5 field MAE (µg/m³) | Note |
|---|---|---|---|
| AirGradient (Open Air O-1PST) | 0.97 to 0.98 | 2.8 to 3.2 | Outdoor model |
| Elitech (Temtop LKC-1000S+) | 0.91 to 0.92 | 3.1 to 3.6 | Handheld |
| Qingping (Air Monitor Lite) | 0.85 to 0.93 | 1.8 to 3.6 | Indoor display unit |
| Atmotube (Pro) | 0.88 | 4.9 to 5.9 | Discontinued |
| PurpleAir (PA-II; 2026 evaluation) | 0.86 to 0.87 | 3.3 to 3.6 | Outdoor model |
| Kaiterra (Laser Egg 2+) | 0.81 to 0.85 | 3.3 to 4.0 | Discontinued |
| IQAir (AirVisual Pro FW1.1683) | 0.63 to 0.81 | 3.5 to 5.5 | Indoor display unit |
| PurpleAir (PA-I-Indoor) | 0.75 | Not reported | Indoor model |
| Airthings (Space Pro) | 0.44 to 0.49 | 5.4 to 8.3 | Tested 2025 |
| uHoo | 0 | 9.5 to 17.8 | Tested 2017 |
The Airthings result shows how a brand name can hide a weak channel. AQ-SPEC’s Airthings Space Pro report ran three units at Rubidoux for 8 weeks in 2025 and rated them “weak correlation” at 1-hour averaging, improving to 0.58 to 0.62 on 24-hour averages. The report tested only PM2.5 and PM10, not the unit’s CO2 or VOC sensors.
The top result comes from an outdoor sensor. AQ-SPEC’s AirGradient report found R² of 0.97 at 5-minute averaging against a Teledyne T640. All of these are outdoor station tests, which EPA notes “may not reflect use indoors.”
Particle type matters too. In the Lawrence Berkeley National Laboratory study of six monitors priced under $300 in October 2018, readings ran about 50% to 200% of actual PM2.5 for ultrasonic humidifiers, vacuuming, incense and frying. If your readings jump during cleaning, our guide to household dust and its HVAC causes explains what is being stirred up.
What do EPA’s sensor targets mean for a home air quality monitor?
EPA’s targets give you a yardstick, though they were written for outdoor sensors. The February 2021 report EPA/600/R-20/280 recommends R² ≥ 0.70, a slope of 1.0 ± 0.35, an intercept between -5 and 5 µg/m³, and RMSE ≤ 7 µg/m³ or NRMSE ≤ 30%. It covers “ambient, outdoor, fixed site” use, and EPA says it does not generally test monitors indoors.
Compare that error with the federal standard. The primary PM2.5 standard in 40 CFR 50.20 is 9.0 µg/m³ as an annual mean and 35 µg/m³ over 24 hours. An MAE of 5.4 to 8.3 µg/m³, the Airthings Space Pro range, is most of the annual standard, so small room-to-room differences mean little.
Can you trust a monitor’s CO2 and VOC readings?
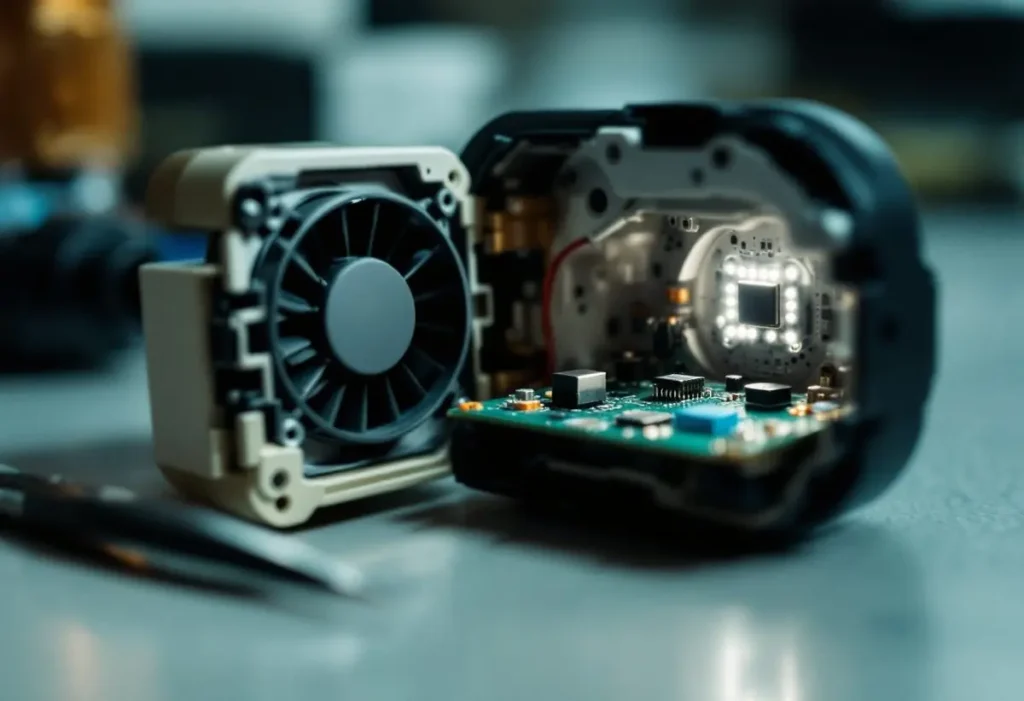
Trust measured CO2, doubt estimated CO2, and treat TVOC as a trend light. In a January 2021 chamber study by Demanega, Singer and colleagues, most devices gave “acceptable responses for carbon dioxide within 15%” but showed “poor quantitative agreement for total volatile organic compounds.”
The same paper warns that “some devices estimate CO2 concentration from TVOC measurements, resulting in substantial errors.” Look for an NDIR CO2 sensor, not “eCO2.” Our explainer on what indoor CO2 ppm numbers mean covers the limits a real CO2 reading should be judged against.
VOC chips are less reliable. AQ-SPEC’s lab found the Sensirion SGP40 chip reached an R² of 0.91 on a low concentration ramp but 0.01 on a high ramp. EPA states that no federally enforceable standards have been set for VOCs in non-industrial settings, and our review of volatile organic compounds in homes covers the sources.
Temperature and humidity are the most dependable channels: the 2021 study found most devices within ±0.6 °C, about 1.1 °F, and ±5% RH. That is close enough to check against the indoor humidity ranges for winter and summer; a dedicated hygrometer you can calibrate is the better tool when mold is the worry.
Where should you put an indoor air quality monitor?
Put it in the breathing zone, away from walls, vents and sources. EPA advises placing a monitor “3-6 feet for a typical adult depending on if they are sitting or standing” and in a spot that does not restrict airflow into it. It says to avoid stoves, fireplaces, cleaning products, HVAC vents and open windows.
- Pick the room where people spend the most hours.
- Set the unit 3 to 6 feet off the floor, out of direct sun and clear of a wall.
- Keep it away from supply registers, windows, the stove and chemical storage.
- Read trends over days and note what happened at each spike.
What should an indoor air quality monitor never replace?
Never a carbon monoxide alarm, a smoke alarm or a proper radon test. EPA says alerts from low-cost monitors “are not designed to warn of the potential for immediate danger,” while CO alarms should be certified to UL Standard 2034 or IAS 6-96. Our guide to where CO alarms go under code covers the clearances.
An alert is not an alarm
A red light means a sensor crossed a threshold the manufacturer picked. EPA notes most pollutants have no widely accepted indoor health-based standard, so treat the color as a prompt to investigate.
Radon has firm federal numbers. EPA’s radon risk page says to fix your home at 4 pCi/L, to consider fixing between 2 and 4 pCi/L, and puts radon’s toll at about 21,000 lung cancer deaths a year. If a radon monitor reads above 4 pCi/L, EPA suggests a long-term test or a radon professional; our explainer on how a radon mitigation fan works covers the fix.

What should you do when the readings rise?
Use the readings to find sources, then apply source control, ventilation and filtration, the three strategies EPA names. A detection alone does not prove a problem, EPA says, but the pattern points to the fix.
If PM2.5 climbs while cooking, EPA suggests turning on exhaust; our guide to range hood ducting and airflow covers sizing.
For a steady particle baseline, compare furnace filter MERV ratings with what a portable air purifier can clean, then confirm the change on the monitor.
How we researched this
Research date: October 31, 2026. We consulted 17 sources and cite 10: AQ-SPEC’s summary table and field reports, EPA’s 2021 PM2.5 sensor report and indoor monitor guidance, and two LBNL peer-reviewed studies. We excluded review-site accuracy scores, since none used a federal reference or equivalent instrument, and report no prices. We skipped Reddit because the topic touches carbon monoxide and radon safety.
Frequently asked questions
Are indoor air quality monitors worth it?
They are worth it for spotting events and trends, not exact numbers. In a 2021 chamber study, most consumer monitors read CO2 within 15% but under-reported particles by up to 50%. Choose one with an NDIR CO2 sensor and an independent PM2.5 test.
Can an air quality monitor detect mold?
Not directly. EPA’s list of what common low-cost monitors measure includes particles, radon, CO, CO2, formaldehyde, VOCs, temperature and humidity, but no mold sensor. Humidity is the useful clue: in a 2021 chamber study, most units read relative humidity within ±5% RH.
Does an indoor air quality monitor detect carbon monoxide?
Some include a CO sensor, but none should replace a CO alarm. EPA says monitor alerts are not designed to warn of immediate danger, and CO alarms should be certified to UL Standard 2034 or IAS 6-96. In a 2017 AQ-SPEC field test, uHoo’s CO sensor correlated poorly with reference instruments.
What is a good PM2.5 reading indoors?
There is no federal indoor PM2.5 limit; EPA says most pollutants lack widely accepted indoor standards. The outdoor standard in 40 CFR 50.20, 9.0 µg/m³ as an annual mean and 35 µg/m³ over 24 hours, is a sensible reference, given monitor error of several µg/m³.
Why does my air quality monitor spike when I cook?
Frying and grilling release particles optical sensors detect. LBNL’s 2020 study found readings of about 50% to 200% of actual PM2.5 for frying or grilling, but little or no response to cooking without them, where particles are smaller than 0.25 µm. A spike is a cue to run exhaust.
Do air quality monitors need calibration?
AQ-SPEC performed no calibration on the sensors it tested, and EPA says all monitors have a limited lifespan and can become less reliable over time. AQ-SPEC notes that a sensor with high R² can be corrected using side-by-side data from a reference monitor.
Sources
- South Coast AQMD. “AQ-SPEC Sensor Summary Table.” https://www.aqmd.gov/aq-spec/evaluations/summary-pm. Accessed October 2026.
- South Coast AQMD. “AQ-SPEC Field Evaluation Report for Airthings Space Pro.” 2025. https://www.aqmd.gov/docs/default-source/aq-spec/field-evaluations/airthings%2D%2Dspace-pro%2D%2D%2Dfield-evaluation.pdf. Accessed October 2026.
- South Coast AQMD. “AQ-SPEC Field Evaluation Report for AirGradient Open Air O-1PST.” 2026. https://www.aqmd.gov/docs/default-source/aq-spec/field-evaluations/airgradient-open-air-o-1pst-%2D-field-evaluation.pdf. Accessed October 2026.
- US EPA. “Performance Testing Protocols, Metrics, and Target Values for Fine Particulate Matter Air Sensors (EPA/600/R-20/280).” 2021. https://cfpub.epa.gov/si/si_public_record_Report.cfm?dirEntryId=350785. Accessed October 2026.
- US EPA. “Low-Cost Air Pollution Monitors and Indoor Air Quality.” https://www.epa.gov/indoor-air-quality-iaq/low-cost-air-pollution-monitors-and-indoor-air-quality. Accessed October 2026.
- Wang Z., Delp W.W., Singer B.C. “Performance of low-cost indoor air quality monitors for PM2.5 and PM10 from residential sources.” Building and Environment, 2020. https://indoor.lbl.gov/publications/performance-low-cost-indoor-air. Accessed October 2026.
- Demanega I. et al. “Performance assessment of low-cost environmental monitors and single sensors under variable indoor air quality and thermal conditions.” Building and Environment, 2021. https://indoor.lbl.gov/publications/performance-assessment-low-cost. Accessed October 2026.
- US EPA. “Volatile Organic Compounds’ Impact on Indoor Air Quality.” https://www.epa.gov/indoor-air-quality-iaq/volatile-organic-compounds-impact-indoor-air-quality. Accessed October 2026.
- US EPA. “Health Risk of Radon.” https://www.epa.gov/radon/health-risk-radon. Accessed October 2026.
- eCFR. “40 CFR 50.20, National primary ambient air quality standards for PM2.5.” https://www.ecfr.gov/current/title-40/chapter-I/subchapter-C/part-50/section-50.20. Accessed October 2026.
Leave a Reply