
How many heat related deaths happen in the US each year? Heat related deaths reached 2,394 in 2024 on final CDC death certificate data, just below the 2023 record of 2,415, and 2026 had already logged 2,114 by October 17.
Key Takeaways
- US deaths with heat on the certificate rose from 1,012 in 2018 to 2,394 in 2024, per CDC WONDER final data.
- Heat was the underlying cause in 1,151 of the 2024 deaths (48%); in the rest it contributed to another cause, such as heart disease (CDC WONDER).
- The widely quoted 2,325 deaths for 2023 was provisional; the final 2023 count is 2,415 (JAMA, 2024; CDC WONDER).
- In Maricopa County, Arizona, an AC unit was present in 94% of 2025 indoor heat deaths, and 72% of those units were not functioning (Maricopa County DPH).
- In New York City, none of the 25 home heat-stress deaths with known AC status had or were using AC (NYC Health, 2026).
- Arizona (810) and Nevada (352) residents accounted for nearly half of 2024 US heat deaths, at 10.7 and 10.8 deaths per 100,000 versus 0.7 nationally (CDC WONDER).
This page counts heat related deaths from federal death certificate data, then reads the medical examiner reports that record what the national file cannot: whether the person had air conditioning and whether it worked. National counts come from our own CDC WONDER query of October 28, 2026 (final data through 2024, provisional for 2025 and 2026).
How many heat-related deaths happen in the US each year?
Between 911 and 2,415 a year since 2018, depending on the summer. Final data show 2,394 deaths in 2024 with heat anywhere on the death certificate, after a record 2,415 in 2023. The 2025 provisional count is 1,866, and 2026 reached 2,114 through October 17.
| Year | Heat anywhere on certificate | Heat as underlying cause (X30) | Data status |
|---|---|---|---|
| 2018 | 1,012 | 535 | Final |
| 2019 | 911 | 505 | Final |
| 2020 | 1,156 | 672 | Final |
| 2021 | 1,602 | 937 | Final |
| 2022 | 1,719 | 977 | Final |
| 2023 | 2,415 | 1,226 | Final |
| 2024 | 2,394 | 1,151 | Final |
| 2025 | 1,866 | 845 | Provisional |
| 2026 (to Oct 17) | 2,114 | Withheld (6 month lag) | Provisional, partial |
Source: CDC WONDER, Provisional Mortality Statistics, 2018 through Last Week, US residents; multiple cause codes X30, T67.0 to T67.9 and P81.0; queried October 28, 2026 (deaths through October 17, 2026, as of October 25, 2026).
The longer view comes from a 2024 JAMA research letter using the same codes: 1,069 deaths in 1999, a low of 311 in 2004, and 21,518 deaths across 1999 to 2023. Hot summers drive the swings; our cooling degree day index tracks how hot each summer ran.
Correction to a common number
Many pages still say 2,325 Americans died of heat in 2023. That figure came from provisional data in the JAMA letter, which flags 2023 as provisional. The final 2023 count on CDC WONDER is 2,415, and 2024 final data (2,394) nearly matched it.
What counts as a heat-related death?
A death counts when the certifier names heat on the death certificate, coded ICD-10 X30 (excessive natural heat), T67 (effects of heat and light) or P81.0 (newborn hyperthermia). Heat can be the underlying cause or a contributing one, and underlying-cause deaths are roughly half of the total.
In 2024 heat was the underlying cause in 1,151 deaths. In the other deaths it contributed to something else: 420 of the 2,394 had a circulatory disease as the underlying cause. A CDC MMWR analysis of 2004 to 2018 found the same pattern, an average of 702 deaths a year, 415 with heat as the underlying cause and 287 as a contributing cause.
| Source | What it counts | Latest count |
|---|---|---|
| CDC WONDER (national) | Heat as underlying or contributing cause, US residents | 2,394 (2024, final) |
| Maricopa County, AZ | Heat-caused (Part I) plus heat-contributed (Part II), deaths in county | 430 (2025): 226 caused, 204 contributed |
| Clark County, NV | X30, T67 or coroner-identified, deaths in county | 284 (2025): 113 heat caused, 171 heat related |
| New York City | Heat-stress deaths (direct) vs modeled heat-exacerbated deaths | 7 a year direct; about 490 a year exacerbated |
Maricopa’s report warns that most jurisdictions report only heat-caused deaths, so its totals are not comparable with places that do not add contributing cases. New York’s 490 is a statistical estimate of excess deaths on hot days, not a certificate count.
Does air conditioning failure show up in heat deaths?
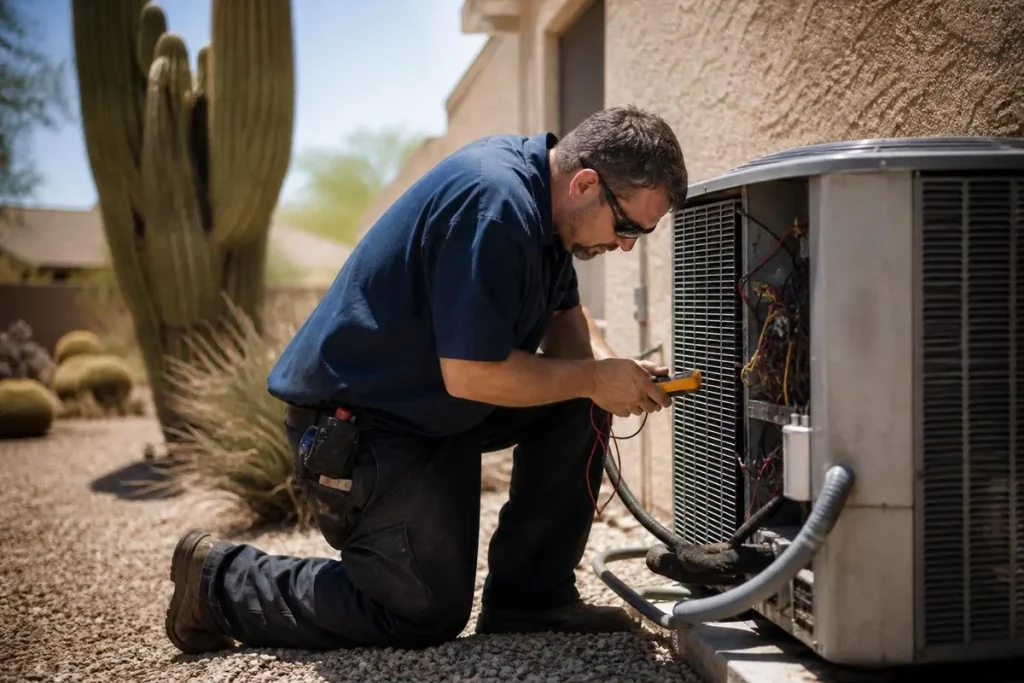
Yes. Where medical examiners record cooling, broken or unused AC dominates indoor heat deaths. Maricopa County found an AC unit present in 94% of 2025 indoor heat deaths and not functioning in 72% of those. The national death file records no AC data at all.
| Maricopa County indoor heat deaths | 2024 | 2025 |
|---|---|---|
| Indoor heat deaths | 138 | 111 |
| AC unit present | 88% | 94% |
| Of AC present: not functioning | 70% | 72% |
| Of AC present: working but not in use | 18% | Not reported |
| Of AC present: no electricity | 9% | Not reported |
| No AC present | 11% | Not reported |
Source: Maricopa County Department of Public Health, 2024 and 2025 Heat-Related Deaths Reports. “Not functioning” means broken or unable to turn on despite electricity; “no electricity” covers units without power.
The 2025 report adds that 23% of indoor deaths happened in an RV, trailer or mobile home, although only 5% of county housing is that type, and 90% of indoor victims were 50 or older. For people living in an RV, cooling usually rests on a single rooftop RV AC unit and whatever power the hookup or generator can supply. Nearly half (48%) of indoor deaths were found during a welfare check. For older occupants a failed system is a health risk, which is why knowing what counts as an HVAC emergency matters more in desert metros.
New York shows the other half of the problem: no AC at all. The 2026 NYC Heat-Related Mortality Report found 48% of heat-stress victims were exposed at home, none of the 25 with known AC status had or were using AC, and 23% had an electric fan on. About 9% of adult New Yorkers had no AC, and another 14% limited use because of cost, the same pattern we track in households that cannot afford to run cooling.
How many US homes have air conditioning?
Most do. The EIA’s 2020 Residential Energy Consumption Survey found 88% of US households use air conditioning, but only 73% in the West and 49% in the marine Pacific Coast climate. Apartments in 2 to 4 unit buildings were at 80%, against 90% for single-family detached homes. State-level equipment shares are in our AC and heat pump map.
EIA also found that households without AC are more likely to rent, a gap that ties into the split incentive between renters and owners and into state landlord air conditioning laws.
Who dies from heat-related causes?
Men, older adults and residents of the desert Southwest. In 2024, males accounted for 1,739 of 2,394 deaths, and the death rate climbed with age to 2.3 per 100,000 among people 85 and older, against 0.7 for the whole population.
| Group (2024) | Deaths | Rate per 100,000 |
|---|---|---|
| Arizona residents | 810 | 10.7 |
| Nevada residents | 352 | 10.8 |
| California residents | 233 | 0.6 |
| Texas residents | 233 | 0.7 |
| Ages 65 to 74 | 506 | 1.4 |
| Ages 75 to 84 | 377 | 2.0 |
| Ages 85 and older | 147 | 2.3 |
| All US residents | 2,394 | 0.7 |
Source: CDC WONDER, multiple cause X30, T67, P81.0, 2024 final data, grouped by residence state, age and sex.
Where people die matters for the cooling question. In 2024, 830 of the 2,394 deaths occurred in the decedent’s home. Local reports show two distinct groups: deaths among people experiencing homelessness, mostly outdoors, who made up 49% of Maricopa’s 2025 deaths, and indoor deaths among older adults in homes with failed or absent cooling.
Clark County, Nevada, shows how much one summer moves the total. The Southern Nevada Health District counted 284 heat-associated deaths in 2025, down 45% from 513 in 2024; 2025 had nine days at 110°F or above, against 36 in 2024.
Why do heat death counts disagree?
Because each source counts a different thing. National data use residence and certificate codes; county reports count deaths that occur in the county and often add medical examiner findings; city studies model excess deaths. All of them likely miss cases where heat was never written on the certificate.
- Check whether the count is heat as underlying cause only, or underlying plus contributing.
- Check whether the year is final or provisional; provisional counts change.
- Check residence versus occurrence; Maricopa counts visitors who die there, CDC counts residents.
- Check whether the figure is a certificate count or a modeled excess death estimate.
Heat on a certificate does not prove a lack of AC caused the death. In Maricopa, 55% of 2025 heat deaths involved substances and 47% had cardiopulmonary disease listed. Cooling access is one risk factor among several, as with the winter carbon monoxide death record on the heating side.
What lowers the risk at home?
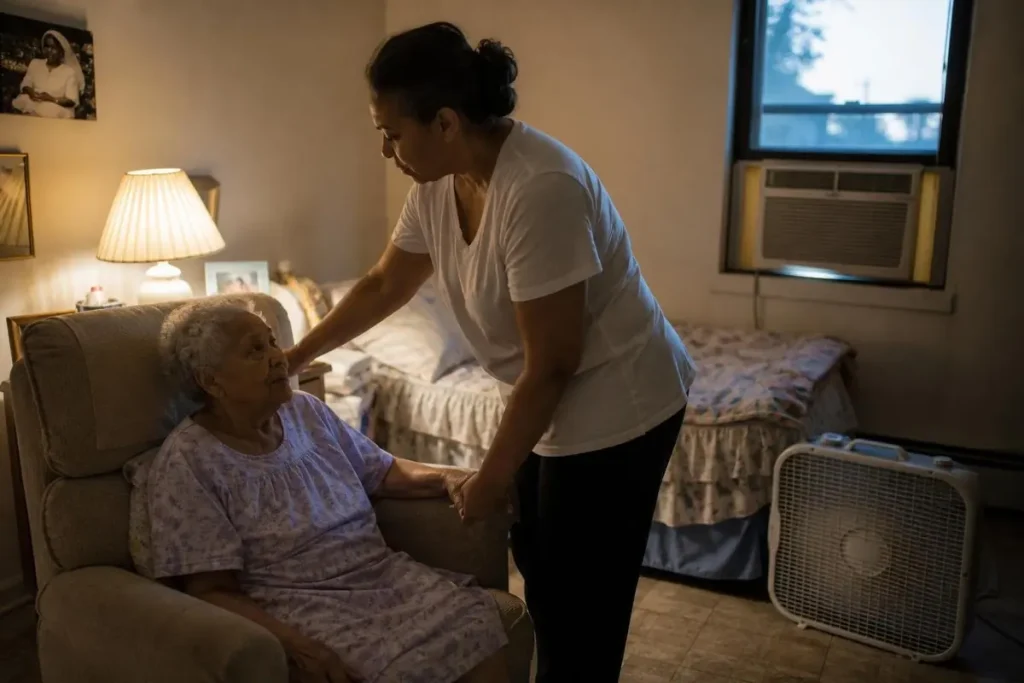
Working cooling, checked before the season, and a plan for outages. Maricopa’s 2024 data show the three ways AC fails people: broken units (70% of indoor cases with AC), units switched off (18%) and no power (9%). Each has a different fix.
- Test the system in spring, before the first heat warning; broken or non-starting units are the largest group in the Maricopa data.
- Budget the summer running cost; cost is why 14% of New Yorkers limit AC use.
- Keep a backup room unit for older relatives who live alone.
- Arrange daily check-ins during heat warnings; 48% of Maricopa’s indoor deaths were found on a welfare check.
For the spring test, our owner checks for an AC that will not start come before any service call. For the budget, our AC running cost estimate works the numbers by state and climate.
If a backup unit makes sense, our explainer on single-hose portable units shows how much capacity that design gives up.
How we researched this
Research date: October 28, 2026. We queried CDC WONDER Provisional Mortality Statistics (final 2018 to 2024, provisional 2025 and 2026) for deaths of US residents with ICD-10 X30, T67 or P81.0 in any cause position, then repeated the query for X30 as the underlying cause and by state, age, sex, place of death and underlying cause chapter. We read the full Maricopa County 2025 and 2024 reports, the Southern Nevada Health District 2025 report, the 2026 NYC report, the 2020 CDC MMWR and the 2024 JAMA letter. Sources opened: 11; cited: 9. Freshness: 5 sources from 2026, 1 from 2025, 3 older and dated in the text. Excluded: modeled estimates (the WHO global fact sheet and a Yale-led JAMA Network Open excess death model), news counts and preliminary dashboard numbers. CDC WONDER suppresses small counts for confidentiality. Reddit was not used on this safety topic. We update this page each spring when final data post.
Frequently asked questions
How common are heat-related deaths in the US?
Heat appeared on 2,394 US death certificates in 2024, final CDC WONDER data show, about 0.7 deaths per 100,000 residents. That is more than double the 1,012 recorded in 2018. Heat was the underlying cause in 1,151 of the 2024 deaths and a contributing cause in the rest.
What counts as a heat-related death?
A death where the certifier lists heat, coded ICD-10 X30, T67 or P81.0. If heat started the chain of events it is the underlying cause; if it worsened another condition, such as heart disease, it is a contributing cause. CDC’s 2004 to 2018 analysis found 415 underlying and 287 contributing deaths a year on average.
What is the deadliest heat-related illness?
Heat stroke. The Southern Nevada Health District describes heat illness as a range from heat exhaustion to heat stroke, which may lead to multi-organ dysfunction. In 2024, 1,151 US deaths listed excessive natural heat (X30) as the underlying cause, with heatstroke coded under T67.0, per CDC WONDER.
Does having air conditioning prevent heat deaths?
Only if it runs. In Maricopa County, an AC unit was present in 94% of 2025 indoor heat deaths, yet 72% of those units were not functioning. In 2024, 18% of present units were working but off and 9% had no electricity, per the county’s reports.
Which state has the most heat-related deaths?
Arizona. CDC WONDER shows 810 Arizona residents died with heat on the certificate in 2024, a rate of 10.7 per 100,000. Nevada had the highest rate at 10.8 (352 deaths). California and Texas each recorded 233 deaths, at much lower rates.
Are heat-related deaths rising in 2026?
Provisional data say yes. CDC WONDER showed 2,114 deaths with heat on the certificate from January 1 through October 17, 2026, already more than the 1,866 provisional total for all of 2025. These counts will change as certificates are completed and coded.
Can an electric fan replace AC in a heat wave?
Not for the highest-risk people. In New York City’s 2026 report, 23% of people who died from heat exposure at home had an electric fan present and on. The city concluded that a fan without AC cannot always prevent death during extreme heat.
Sources
- CDC, National Center for Health Statistics. “Provisional Mortality Statistics, 2018 through Last Week (CDC WONDER).” https://wonder.cdc.gov/mcd-icd10-provisional.html. Accessed October 2026.
- Maricopa County Department of Public Health. “2025 Heat-Related Deaths Report.” https://www.maricopa.gov/Archive.aspx?ADID=6510. Accessed October 2026.
- Maricopa County Department of Public Health. “2024 Heat-Related Deaths Report.” https://www.maricopa.gov/Archive.aspx?ADID=5934. Accessed October 2026.
- Southern Nevada Health District. “Heat-Associated Deaths and Emergency Department Visits, 2025 Report.” https://media.southernnevadahealthdistrict.org/download/heat-death-report-final-2025.pdf. Accessed October 2026.
- NYC Department of Health and Mental Hygiene. “2026 NYC Heat-Related Mortality Report.” https://a816-dohbesp.nyc.gov/IndicatorPublic/data-features/heat-report/. Accessed October 2026.
- U.S. Energy Information Administration. “Nearly 90% of U.S. households used air conditioning in 2020.” https://www.eia.gov/todayinenergy/detail.php?id=52558. Accessed October 2026.
- CDC. “Heat-Related Deaths, United States, 2004 to 2018.” MMWR 69(24). https://www.cdc.gov/mmwr/volumes/69/wr/mm6924a1.htm. Accessed October 2026.
- Howard JT et al. “Trends of Heat-Related Deaths in the US, 1999-2023.” JAMA, 2024. https://pmc.ncbi.nlm.nih.gov/articles/PMC11348089/. Accessed October 2026.
- CDC Environmental Public Health Tracking. “Heat and Heat-related Illness.” https://www.cdc.gov/environmental-health-tracking/php/data-research/heat-heat-related-illness.html. Accessed October 2026.
Leave a Reply