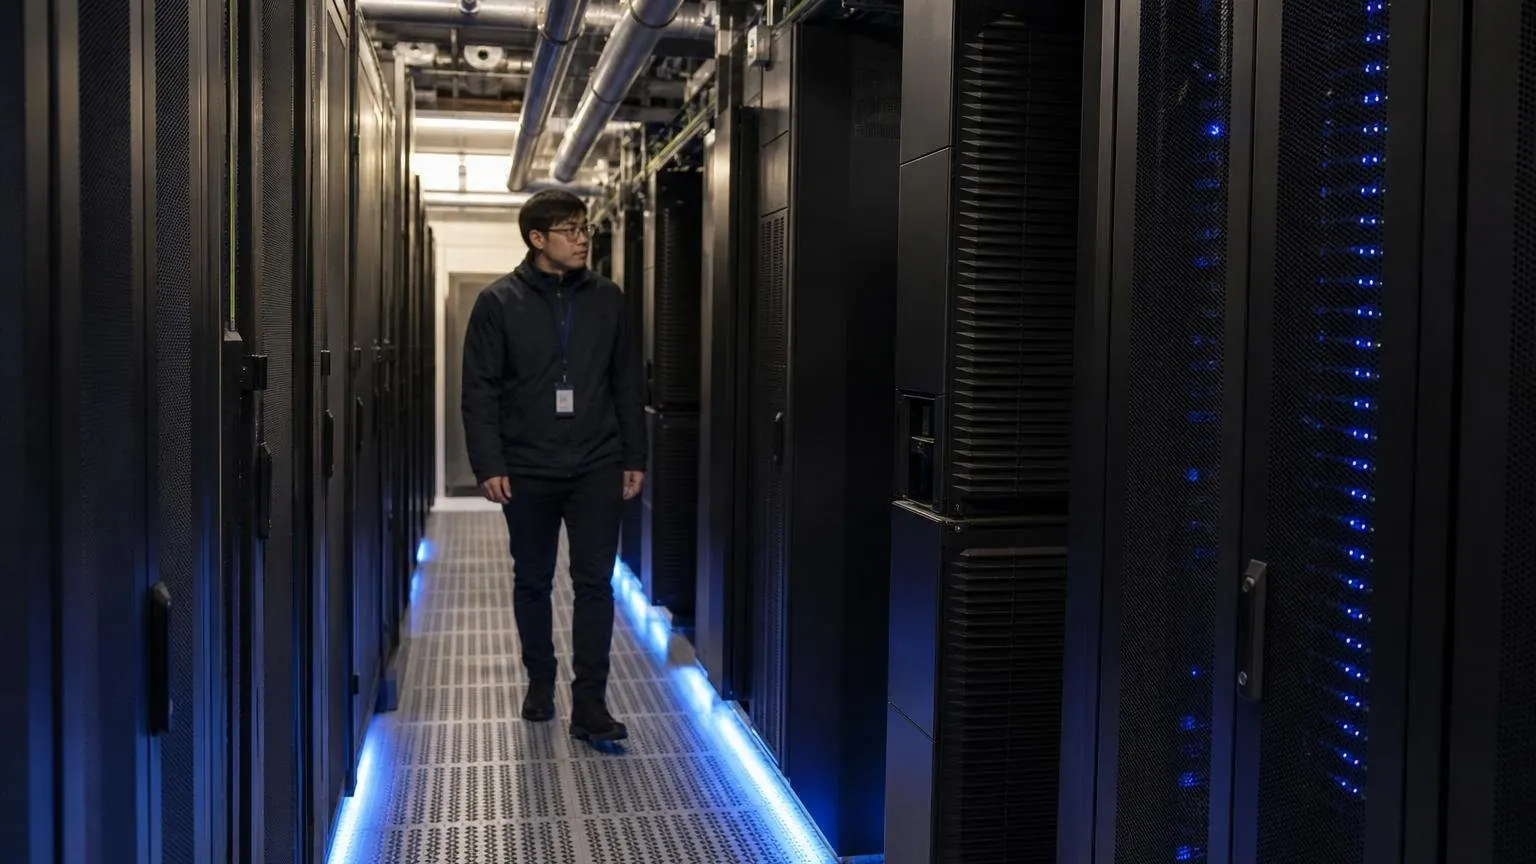
What is data center PUE? Data center PUE, or power usage effectiveness, is total facility energy divided by the energy delivered to IT equipment. The industry average was 1.52 in 2026, per Uptime Institute, while Google, Meta and AWS report fleet averages of 1.08 to 1.14.
Key Takeaways
- The survey average fell from 2.50 in 2007 to 1.65 in 2014, then only to 1.52 by 2026 (Uptime Institute, 2026).
- Giving larger facilities proportional weight yields a 2026 average of 1.36 (Uptime Intelligence, August 2026).
- Google reported a fleet trailing twelve-month PUE of 1.09 through Q2 2026 (Google); Meta reported 1.08 for 2024, AWS 1.14 for 2025 and Microsoft 1.17 for fiscal 2025.
- US data centers used 176 TWh in 2023, 4.4% of US electricity, and could use 325 to 580 TWh by 2028 (LBNL, December 2024).
- LBNL models the average US data center PUE falling from 1.6 in 2014 to 1.4 in 2023, and to between 1.15 and 1.35 by 2028 (LBNL).
- For a 1 MW IT load, 1.52 instead of 1.09 adds 3,766.8 MWh of overhead a year, about $503,621 at 13.37 cents per kWh (our math on EIA prices).
Every data center PUE figure below traces to a primary document and carries its year and basis, because a trailing twelve-month fleet figure and a self-reported survey answer are different measurements.
What is data center PUE and how is it calculated?
Data center PUE is total facility energy divided by IT equipment energy, measured over a full year. A PUE of 1.0 would mean every kilowatt hour reaches servers, storage and network gear; everything above 1.0 is overhead for cooling, power conversion and lighting.
The Green Grid introduced the metric in 2007 and later handed it to ISO/IEC, which publishes it as ISO/IEC 30134-2. The DOE Federal Energy Management Program guide notes that PUE is mathematically bounded from 1.0 to infinity and is defined on annual energy, so it captures free cooling seasons and shifting IT loads. Google’s plain version: a PUE of 2.0 means that for every watt of IT power, an additional watt is consumed to cool and distribute power.
- Meter total facility energy for 12 months, including cooling plant, fans, pumps, UPS and distribution losses, and lighting.
- Meter IT equipment energy at the IT load for the same 12 months.
- Divide total by IT. A 1 MW IT load running all year uses 8,760 MWh; a facility total of 13,315.2 MWh gives a PUE of 1.52.
- Publish the boundary with the result. Google counts water treatment plants and office space as overhead, and said in 2013 it could strip those out and report 1.06 or less.
NLR (formerly NREL) meters lights and plugs, cooling, pumps, HVAC fan walls and IT separately at its ESIF data center, a point list any building automation system can trend.
What is the average data center PUE in 2026?
The average annual PUE is 1.52 in 2026 across 644 facilities in Uptime Institute’s survey, down from 1.54 in 2025 and 1.56 in 2024. Uptime calls it a seven-year trend of relative stasis: every reading since 2020 has landed between 1.52 and 1.59.
| Survey year | Average annual PUE | What changed |
|---|---|---|
| 2007 | 2.50 | First year of the series |
| 2011 | 1.98 | Early airflow and controls upgrades |
| 2014 | 1.65 | End of the steep decline |
| 2018 | 1.58 | Plateau begins |
| 2019 | 1.67 | Up from 1.58 in 2018 |
| 2020 | 1.59 | Seven-year band starts |
| 2021 | 1.57 | |
| 2022 | 1.55 | |
| 2023 | 1.58 | |
| 2024 | 1.56 | |
| 2025 | 1.54 | n=681 |
| 2026 | 1.52 | n=644; lowest in the series |
Source: Uptime Institute Global Data Center Survey 2026, Figure 2; 2025 sample size from the 2025 survey. Uptime did not chart the omitted years.
The single average hides a wide spread. Respondents’ largest data centers averaged 1.45 in 2026, 23% of respondents work in a facility averaging below 1.3, and 27% work in data centers more than 15 years old. Uptime expects slow progress as builds move into subtropical and desert regions; our 2026 HVAC industry statistics track the equipment side.
Two averages, both correct
Uptime’s 1.52 counts every facility equally. Uptime Intelligence reran the data in August 2026 with larger facilities given proportional weight and got 1.36. The first describes the typical site; the second sits closer to the average megawatt.
What PUE do Google, Meta, Microsoft and AWS report?
Hyperscale fleets report 1.08 to 1.17, far below the 1.52 survey average. Each operator uses its own boundary and period, so read the table’s basis column before comparing.
| Operator | Reported PUE | Period | Basis | Prior figure |
|---|---|---|---|---|
| Meta | 1.08 | Calendar 2024 | Meters, design estimates, utility bills | 1.10 in 2020 |
| 1.09 | TTM through Q2 2026 | Large-scale sites once stable, all overhead | 1.21 TTM in 2008 | |
| AWS | 1.14 | Calendar 2025 | Global average, ISO principles | 1.15 in 2024 |
| Microsoft | 1.17 | FY25 (July 2024 to June 2025) | Fully owned sites operating 12 months | 1.16 in FY24 |
| NLR ESIF (federal lab) | 1.036 | Annualized | One HPC data center | Design goal 1.06 or better |
Sources: Google, Meta, Amazon, Microsoft and NLR disclosures listed below, accessed October 2026.
Climate shows in campus data. In Q2 2026, Google’s campus TTM figures ran from 1.04 at Central Ohio (Lancaster) to 1.15 at Storey County, Nevada and its second Singapore campus, and a new Mesa, Arizona campus posted a quarterly 1.28. AWS reports 1.11 for Europe against 1.29 for the Middle East in 2025, and Microsoft’s Asia Pacific fleet ran 1.28 in FY25 versus 1.16 in the Americas.
Google says its 1.09 means 83% less overhead than the industry, comparing its 0.09 with the 0.54 implied by Uptime’s 2025 average of 1.54. Meta’s 2025 Environmental Data Index shows its fleet flat at 1.08 from 2022 through 2024.
What is a good PUE for a data center?
DOE’s Federal Energy Management Program rates 1.6 as standard, 1.4 as good and 1.1 as better. Against the 2026 survey, a site at 1.4 already beats the 1.52 industry average, and one below 1.3 joins the 23% of respondents Uptime places in that efficient group.
Federal sources disagree on the average. The FEMP guide (July 2024) says 1.6, while the NLR PUE page says around 1.8, with efficiency-focused data centers typically at 1.2 or less. Neither reflects the 2026 survey. For a small IT closet, the choices in our server room cooling guide matter more than chasing 1.1.
PUE is a trend metric, not a league table
Uptime’s 2026 report says PUE suits tracking one site over time or large samples, not comparing a few differing facilities. The vendor blog line “around 2.0 is average” is a decade stale: Uptime’s average was 1.98 in 2011 and 1.65 by 2014.
What does a high data center PUE cost in electricity?
On a 1 MW IT load running all year, every 0.1 of PUE is 876 MWh of overhead. Moving from 1.52 to 1.09 saves 3,766.8 MWh a year, worth about $503,621 at the 2025 US commercial average of 13.37 cents per kWh, or $320,555 at the industrial average of 8.51 cents.
| PUE | Reference point | Facility total (MWh/yr) | Overhead (MWh/yr) | Overhead share | Overhead cost at 13.37¢/kWh |
|---|---|---|---|---|---|
| 2.0 | Google’s worked example | 17,520 | 8,760 | 50.0% | $1,171,212 |
| 1.6 | FEMP “standard” | 14,016 | 5,256 | 37.5% | $702,727 |
| 1.52 | Uptime 2026 average | 13,315.2 | 4,555.2 | 34.2% | $609,030 |
| 1.4 | FEMP “good” | 12,264 | 3,504 | 28.6% | $468,485 |
| 1.09 | Google fleet TTM | 9,548.4 | 788.4 | 8.3% | $105,409 |
Our arithmetic: 1,000 kW of IT load for 8,760 hours, times PUE. Price: EIA Electric Power Monthly Table 5.3, 2025 commercial average. Real tariffs differ.
Local rates swing the answer; our state electricity price table shows the spread. At 1.52, about a third of every purchased kilowatt hour never reaches IT.
How much electricity do US data centers use?
US data centers used about 176 TWh in 2023, 4.4% of national electricity, according to Lawrence Berkeley National Laboratory’s December 2024 report. LBNL projects 325 to 580 TWh by 2028, or 6.7% to 12.0% of forecast US consumption.
LBNL’s modeled US average PUE fell from 1.6 in 2014 to 1.4 in 2023, mainly because servers moved into hyperscale and colocation buildings, which held about 75% of servers by 2023. By our arithmetic, a 30% infrastructure share of 176 TWh is roughly 52.8 TWh of cooling and power overhead in 2023. LBNL expects 1.15 to 1.35 by 2028, driven by the same shift plus liquid-cooled AI servers, while warning that real systems rarely run as designed.
How does cooling design change data center PUE?
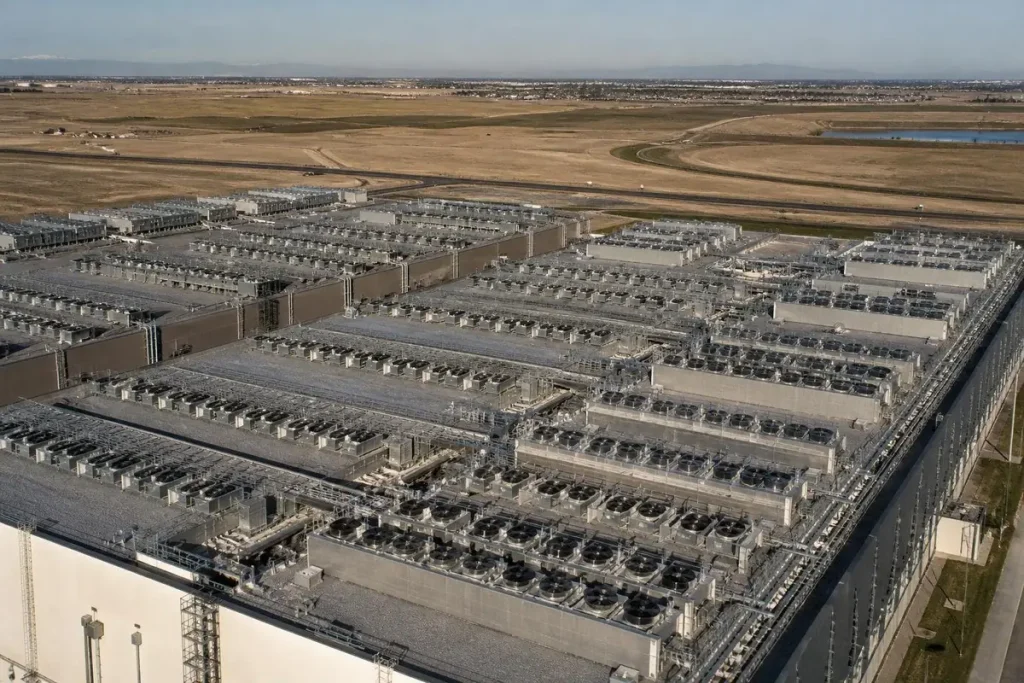
Cooling is the largest overhead lever. LBNL finds economizers, adiabatic cooling and dry coolers lower PUE, and DOE says many cool-climate data centers use only economizer cooling and no DX (direct expansion) cooling.
ASHRAE’s 2021 guidelines, as restated by FEMP, recommend 64.4 to 80.6°F (18 to 27°C) server inlet air, with class A1 allowable from 59 to 89.6°F. That 80°F ceiling allows far more economizer hours than an office building gets, and air-side systems add a dew point lockout for air that is too dry or too moist.
| Approach | How it cuts overhead | Where it fits (per DOE and LBNL) |
|---|---|---|
| Air-side economizer | Outside air replaces mechanical cooling | Most nights and mild winters; MERV 13 filters |
| Water-side economizer | Cooling tower makes chilled water, bypassing chillers | Wet bulb below 55°F for 3,000 or more hours a year |
| Air-side plus adiabatic | Outside air, evaporative assist on hot days | Prevalent among hyperscale sites |
| Direct liquid cooling | Warmer coolant extends economizer hours | High-density AI racks |
The water-side test is written in wet bulb hours because a cooling tower can only approach outdoor wet bulb.
Where compressors run, FEMP benchmarks the plant at 1.1 kW per ton as standard, 0.8 as good and 0.6 as better; warmer chilled water adds economizer hours around a water-cooled chiller. On the air side, FEMP rates total fan power per unit of airflow, supply to return, at 1.25 W/cfm as standard and 0.75 W/cfm as good, which puts every fan in each air handling unit on the scorecard.
Density keeps rising: the average modal rack passed 11 kW in 2026, up from 9 kW, and 24% of Uptime respondents run some racks at 30 kW or above, up from 19%.
What is WUE, and does a low PUE cost water?
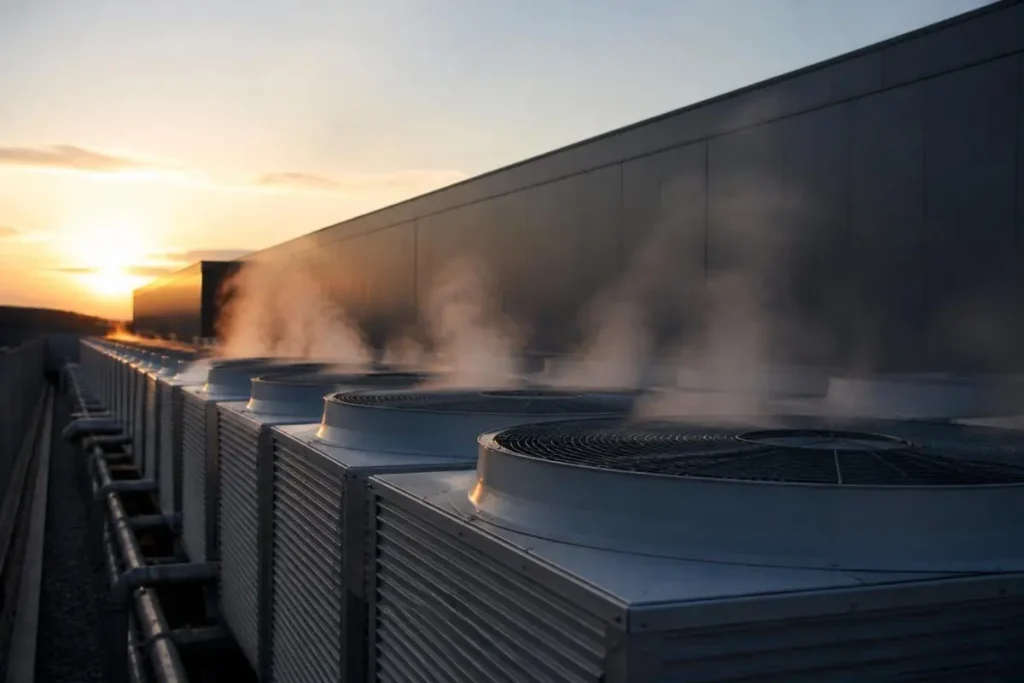
Water usage effectiveness (WUE) is liters of water per kWh of IT energy. It often moves against PUE: LBNL notes that water-cooled chillers and evaporative systems are generally more energy efficient than air-cooled chillers, which use no water but more energy.
Boundaries differ. Meta reported a WUE of 0.19 for 2024 on water withdrawal; Microsoft 0.27 L/kWh for FY25, down from 0.30, counting humidification and cooling water; AWS 0.12 L/kWh withdrawn in 2025. Like the swamp cooler in our evaporative cooling guide, adiabatic cooling trades water for compressor energy.
How we researched this
Research date: October 30, 2026. We read the full Uptime 2026 and 2025 survey reports, Uptime Update 518, Google’s quarterly PUE tables, Meta’s data index, the Microsoft and AWS disclosures, LBNL’s 2024 report, the DOE FEMP guide, the NLR page and EIA price tables. Sources opened: 16, including three competing articles; cited: 10. Freshness: 4 from 2026, 4 from 2025, 2 from 2024, dated in the text. Excluded: Statista and vendor glossaries, an undocumented Microsoft “design PUE 1.12” and hyperscaler ranges from secondary summaries. Operator figures are self-reported on different boundaries; cost figures are our arithmetic. We update each July when Uptime publishes.
Frequently asked questions
What is a good PUE for a data center?
DOE’s Federal Energy Management Program benchmarks 1.6 as standard, 1.4 as good and 1.1 as better. The 2026 Uptime Institute survey average is 1.52, so a site at 1.4 is better than typical. Hyperscale fleets report 1.08 to 1.17.
What is Google’s data center PUE?
Google reported a fleet trailing twelve-month PUE of 1.09 through Q2 2026, with a quarterly PUE of 1.10 for that quarter. Campus figures ranged from 1.04 to 1.15. Google’s first public fleet figure, in 2008, was a trailing 1.21.
How do you calculate PUE?
Divide a year of total facility energy by a year of IT equipment energy. A 1 MW IT load uses 8,760 MWh a year; if the whole facility uses 13,315.2 MWh, PUE is 1.52, the 2026 industry average. The DOE FEMP guide defines PUE on annual energy so seasonal free cooling counts.
Can PUE be less than 1.0?
No. The DOE FEMP guide says PUE is mathematically bounded from 1.0 to infinity, and 1.0 would mean all power reaches IT equipment with none for cooling or lighting. A related metric, energy reuse effectiveness (ERE), can fall below 1.0 when a facility exports waste heat. NLR’s ESIF data center reports an annualized PUE of 1.036.
Why has average PUE stopped falling?
The cheap fixes are done. Uptime says containment, blanking panels, relaxed supply temperatures and better controls drove the drop from 2.50 in 2007 to 1.65 in 2014. Since then, gains come mostly from new buildings, while 27% of 2026 respondents still work in data centers over 15 years old.
What is the difference between PUE and WUE?
PUE measures energy overhead and has no unit; WUE measures liters of water per kWh of IT energy. Evaporative cooling saves compressor energy but uses water, so they often trade off. In 2025, AWS reported a global PUE of 1.14 and a WUE of 0.12 L/kWh; Microsoft reported 1.17 and 0.27 for FY25.
Sources
- Uptime Institute. “Global Data Center Survey 2026” (July 2026). https://datacenter.uptimeinstitute.com/rs/711-RIA-145/images/UptimeInstitute.GlobalDataCenterSurvey.2026.pdf. Accessed October 2026.
- Uptime Intelligence. “The growing PUE advantage of larger data centers” (August 2026). https://intelligence.uptimeinstitute.com/resource/growing-pue-advantage-larger-data-centers. Accessed October 2026.
- Google. “Power usage effectiveness.” https://datacenters.google/efficiency/. Accessed October 2026.
- Meta. “2025 Environmental Data Index” (fiscal 2024). https://sustainability.atmeta.com/wp-content/uploads/2025/10/Meta_2025-Environmental-Data-Index.pdf. Accessed October 2026.
- Amazon. “AWS Cloud.” https://sustainability.aboutamazon.com/products-services/aws-cloud. Accessed October 2026.
- Microsoft. “Datacenter efficiency.” https://datacenters.microsoft.com/sustainability/efficiency/. Accessed October 2026.
- Lawrence Berkeley National Laboratory. “2024 United States Data Center Energy Usage Report.” https://escholarship.org/uc/item/32d6m0d1. Accessed October 2026.
- DOE Federal Energy Management Program. “Best Practices Guide for Energy-Efficient Data Center Design” (July 2024). https://www.energy.gov/sites/default/files/2024-07/best-practice-guide-data-center-design.pdf. Accessed October 2026.
- National Laboratory of the Rockies (formerly NREL). “Measuring Efficiency: Power Usage Effectiveness.” https://www.nlr.gov/computational-science/measuring-efficiency-pue. Accessed October 2026.
- US Energy Information Administration. “Electric Power Monthly, Table 5.3.” https://www.eia.gov/electricity/monthly/epm_table_grapher.php?t=epmt_5_3. Accessed October 2026.
Leave a Reply