
What is sick building syndrome? Sick building syndrome is a cluster of headaches, eye, nose and throat irritation, fatigue and poor concentration that occupants tie to time in one building and that eases after they leave, with no specific illness or cause identified. Inadequate ventilation is the most cited culprit.
Key Takeaways
- EPA defines it by exclusion: “no specific illness or cause can be identified,” per its Indoor Air Facts No. 4.
- In NIOSH worker-complaint investigations summarized in 1988, 52% found inadequate ventilation, per Stanevich in the NIOSHTIC database.
- In EPA’s BASE study of 100 ordinary US offices, 45% of 4,326 workers reported at least one work-related symptom (Brightman et al., 2008).
- Cutting outdoor air from 10 to 5 L/s per person raises relative symptom prevalence about 23%, per an LBNL analysis (Fisk et al., 2009).
- Office workers with lower outdoor air had a 1.53 relative risk of short-term sick leave (Milton et al., 2000).
- EPA says air sampling “seldom provides information about possible causes” (EPA).
What is sick building syndrome?
Sick building syndrome (SBS) describes occupants who experience “acute health and comfort effects that appear to be linked to time spent in a building, but no specific illness or cause can be identified,” in the words of EPA’s 1991 Indoor Air Facts No. 4.
The scale estimate everyone repeats comes from that sheet: EPA wrote that a 1984 World Health Organization committee report “suggested that up to 30 percent of new and remodeled buildings worldwide may be the subject of excessive complaints related to indoor air quality.” That is a 1980s complaint estimate, not a measured rate of sick buildings.
Later federal data argue against a sick or healthy label. Analyzing EPA’s Building Assessment Survey and Evaluation (BASE) study of 100 randomly selected US offices, Brightman and colleagues found 45% of 4,326 respondents reported at least one work-related symptom and 20% reported three or more. Building-related symptoms, they concluded, “span a continuum.”
What are the symptoms of sick building syndrome?
EPA lists headache; eye, nose or throat irritation; dry cough; dry or itchy skin; dizziness and nausea; difficulty concentrating; fatigue; and sensitivity to odors. The defining feature is timing: per EPA, most complainants “report relief soon after leaving the building.”
The BASE analysis found the same four symptom groups (tiredness, mucosal irritation, neuropsychological and lower respiratory) as NIOSH’s survey of 80 complaint buildings. Symptoms were more common in the NIOSH buildings, but the distributions overlapped.
How is sick building syndrome different from building-related illness?
Building-related illness (BRI) is the diagnosable version. EPA uses BRI when symptoms “can be clinically defined and have clearly identifiable causes,” such as cough, chest tightness, fever and muscle aches, and recovery after leaving can be prolonged. Legionella, which has caused Legionnaires’ disease and Pontiac fever, is EPA’s example. Radon and asbestos are excluded because they cause disease years later.
What causes sick building syndrome?
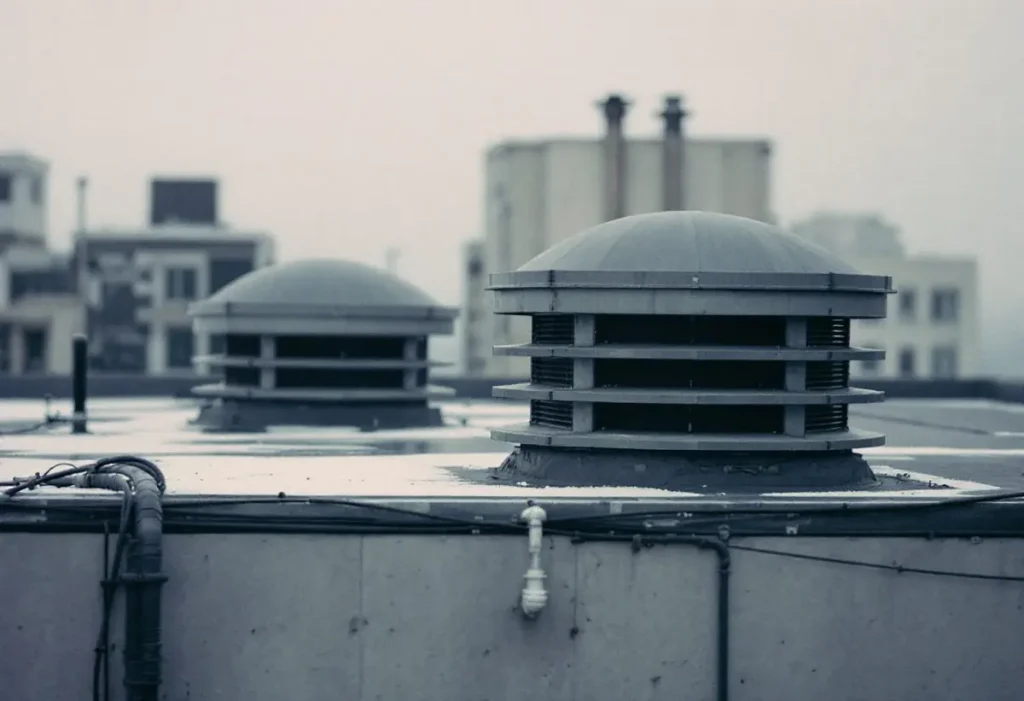
No single cause exists, but investigators point first at outdoor air. A 1988 summary of NIOSH investigations prompted by worker complaints reported that 52% concluded ventilation was inadequate. It attributed 16% to indoor sources, 10% to outside contamination, 5% to microbial contamination and 4% to building materials and products.
EPA names the same families. Indoor sources include adhesives, carpeting, manufactured wood products, copy machines and cleaning agents that emit volatile organic compounds such as formaldehyde. Vehicle and building exhausts enter through poorly located intakes, and microbes breed in stagnant water in ducts, humidifiers and drain pans.
Thermal conditions matter too. In 95 BASE buildings, Mendell and Mirer (2009) found higher winter indoor temperatures were associated with increases in all symptoms analyzed, while summer temperatures above 23 C (about 73 F) went with fewer symptoms because buildings were overcooled. Compare our guide to office temperature standards.
What does the ventilation research show about sick building syndrome?
More outdoor air per person means fewer symptoms, with diminishing returns. A review by Seppänen, Fisk and Mendell (1999) covered 20 ventilation studies with close to 30,000 subjects. Almost all found rates below 10 L/s per person were associated with significantly worse outcomes.
About half the carbon dioxide studies saw symptom risk keep falling below 800 ppm. CO2 is a proxy for outdoor air per occupant, not the irritant, as our explainer on indoor CO2 levels details.
Fisk, Mirer and Mendell at Lawrence Berkeley National Laboratory pooled studies into a curve. Dropping from 10 to 5 L/s per person raised relative SBS symptom prevalence about 23%, and raising it from 10 to 25 L/s cut prevalence about 29%. On an index where 10 L/s equals 100, that is about 123 at 5 L/s and 71 at 25 L/s.
History explains the 1980s complaint wave. EPA recounts that standards of about 15 cfm of outside air per occupant were cut to 5 cfm after the 1973 oil embargo, and that ASHRAE Standard 62-1989 restored 15 cfm, with 20 cfm per person in offices. For whole-room dilution math, see our air changes per hour worked examples.
The cost shows up in absence data. Among office workers at a Massachusetts manufacturer in 1994, Milton and colleagues found a 1.53 relative risk of short-term sick leave with moderate (about 25 cfm per person) rather than high (about 50 cfm per person) outdoor air, and estimated 35% of that sick leave was attributable to the lower rate.
How do investigators find the cause of a sick building?
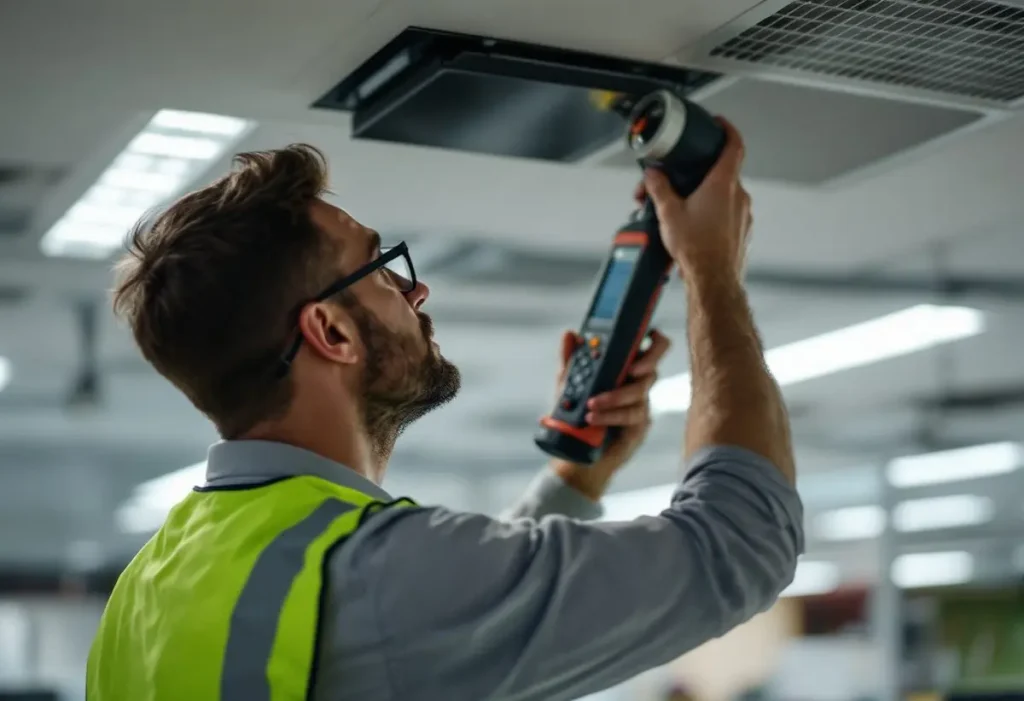
They run a cycle of information gathering, hypothesis and testing, not a lab panel. EPA’s procedure starts with a walkthrough covering four factors: the occupants, the HVAC system, pollutant pathways and contaminant sources.
- Document building history and complaints, and map HVAC zones against complaint areas.
- Walk the space and talk to occupants and staff.
- Take quick readings of temperature, relative humidity, CO2 and air movement for a snapshot of conditions.
- Form a hypothesis, change one thing, and check whether complaints fall; repeat until they do.
- Sample for specific contaminants only once operation is understood.
Myth: an air test will find the problem
EPA says air sampling “seldom provides information about possible causes” and can mislead, because “contaminant concentration levels rarely exceed existing standards and guidelines even when occupants continue to report health complaints.” A low-cost indoor air quality monitor can still help log CO2 and humidity over time.
Mold follows the same logic. A review of the epidemiologic evidence by Mendell and colleagues (2011) tied visible dampness or mold to asthma, cough, wheeze and upper respiratory symptoms, but concluded current evidence does not support measuring specific microbiologic factors to guide action. Find the water first, as our guide to mold in HVAC ducts explains.
How do you fix sick building syndrome?
Fix the building: restore outdoor air, remove or isolate sources, and dry anything wet. EPA’s solutions are source control, more ventilation and better air distribution, air cleaning as an adjunct, and communication with occupants.
| Suspected cause | What to check | Typical fix | Source |
|---|---|---|---|
| Inadequate outdoor air | CO2 trend versus outdoors; outdoor air damper position; design airflow | Run the system to at least its design ventilation rate | EPA; Seppänen et al. 1999 |
| Poor air distribution | Blocked supply vents or return grilles; unbalanced zones | Clear vents; rebalance zones that stay uneven | EPA occupant guide; EPA fact sheet |
| Indoor chemical sources | New carpet, furniture, adhesives; copy and print rooms | Off-gas before occupancy; local exhaust for copy rooms | EPA Indoor Air Facts No. 4 |
| Outdoor contaminants | Intakes near loading docks, garages, plumbing vents | Relocate intakes or isolate the source | EPA Indoor Air Facts No. 4 |
| Moisture and microbes | Drain pans, humidifiers, water-stained ceiling tile | Dry materials within 24 hours; replace stained tile | EPA; Mendell et al. 2011 |
| Thermal conditions | Temperature logs by season | Avoid overheating in winter and overcooling in summer | Mendell and Mirer 2009 |
EPA notes many systems are designed to code but “are not operated or maintained to ensure that these design ventilation rates are provided.” Restoring them often means rebalancing airflow to each zone, and in larger renovations, a dedicated outdoor air system separates ventilation from heating and cooling.
Air cleaners have “limited application,” EPA says, partly because mechanical filters do not remove gases. Its occupant guide adds that water-damaged materials should usually be dried within 24 hours; humidity too high feeds microbes, and too low irritates eyes and sinuses.
Can sick building syndrome happen at home?
The research base is offices, but the mechanisms exist in houses. EPA names unvented kerosene and gas space heaters, woodstoves, fireplaces and gas stoves as combustion sources. Most houses also lack an engineered outdoor air supply.
Start with our guide to what ventilation means in HVAC lays out, then hold humidity in the range in our ideal indoor humidity guide. Fever, chest tightness or symptoms that persist away from home point to a diagnosable condition, so see a clinician.
How we researched this
Researched October 31, 2026. We read the top pages for “sick building syndrome” (Healthline, NHS, Wikipedia) and traced every number to EPA, OSHA, NIOSH records and seven peer-reviewed papers read as PubMed abstracts. Reddit was skipped (health topic). Excluded: vendor pages and unsourced prevalence figures. We did no testing.
Frequently asked questions
Is sick building syndrome a real medical diagnosis?
Not a specific one. EPA uses the term when “no specific illness or cause can be identified.” A clinically defined illness traced to a building contaminant is building-related illness instead. The symptoms are real: 45% of BASE office workers reported at least one.
How long do sick building syndrome symptoms last?
Usually only while you are inside. EPA lists relief soon after leaving the building as an indicator. Symptoms needing prolonged recovery fit EPA’s description of building-related illness and call for a medical evaluation.
What is the most common cause of sick building syndrome?
Inadequate ventilation. In NIOSH complaint investigations summarized in 1988, 52% found ventilation inadequate, ahead of indoor sources at 16%. Later reviews link rates below 10 L/s per person, about 21 cfm, with worse outcomes.
Can mold cause sick building syndrome?
Dampness and mold are linked to symptoms. A 2011 Environmental Health Perspectives review tied visible dampness or mold to asthma, cough and wheeze, and NIOSH’s 1988 summary named microbes the primary problem in 5% of investigations. Dry the water source first.
Can air conditioning cause sick building syndrome?
It is associated with more symptoms. A 1990 reanalysis of six European studies found air-conditioned offices consistently had more headache, lethargy and upper respiratory symptoms than naturally ventilated ones. Mechanical ventilation without air conditioning showed no increase.
Does OSHA have a standard for sick building syndrome?
No. OSHA states that it “does not have IAQ standards,” though it has ventilation and contaminant standards. Employees, union officials or employers can instead request a NIOSH Health Hazard Evaluation.
Sources
- US EPA. “Indoor Air Facts No. 4 (revised): Sick Building Syndrome.” 1991. https://www.epa.gov/sites/default/files/2014-08/documents/sick_building_factsheet.pdf. Accessed October 2026.
- US EPA. “An Office Building Occupant’s Guide to Indoor Air Quality.” https://www.epa.gov/indoor-air-quality-iaq/office-building-occupants-guide-indoor-air-quality. Accessed October 2026.
- Stanevich R.S. “Indoor air pollution. Problems and solutions.” Office Systems, 1988 (NIOSHTIC record). https://stacks.cdc.gov/view/cdc/242694. Accessed October 2026.
- Brightman H.S. et al. “Evaluating building-related symptoms using the US EPA BASE study results.” Indoor Air, 2008. https://pubmed.ncbi.nlm.nih.gov/18717984/. Accessed October 2026.
- Seppänen O.A., Fisk W.J., Mendell M.J. “Association of ventilation rates and CO2 concentrations with health and other responses in commercial and institutional buildings.” Indoor Air, 1999. https://pubmed.ncbi.nlm.nih.gov/10649857/. Accessed October 2026.
- Fisk W.J., Mirer A.G., Mendell M.J. “Quantitative relationship of sick building syndrome symptoms with ventilation rates.” Indoor Air, 2009. https://pubmed.ncbi.nlm.nih.gov/19207289/. Accessed October 2026.
- Milton D.K., Glencross P.M., Walters M.D. “Risk of sick leave associated with outdoor air supply rate, humidification, and occupant complaints.” Indoor Air, 2000. https://pubmed.ncbi.nlm.nih.gov/11089326/. Accessed October 2026.
- Mendell M.J., Smith A.H. “Consistent pattern of elevated symptoms in air-conditioned office buildings.” American Journal of Public Health, 1990. https://pubmed.ncbi.nlm.nih.gov/2400029/. Accessed October 2026.
- Mendell M.J., Mirer A.G. “Indoor thermal factors and symptoms in office workers: findings from the US EPA BASE study.” Indoor Air, 2009. https://pubmed.ncbi.nlm.nih.gov/19302503/. Accessed October 2026.
- Mendell M.J. et al. “Respiratory and allergic health effects of dampness, mold, and dampness-related agents.” Environmental Health Perspectives, 2011. https://pubmed.ncbi.nlm.nih.gov/21269928/. Accessed October 2026.
- OSHA. “Indoor Air Quality.” https://www.osha.gov/indoor-air-quality. Accessed October 2026.
- NIOSH. “Request a Health Hazard Evaluation.” https://www.cdc.gov/niosh/hhe/request/index.html. Accessed October 2026.
Leave a Reply