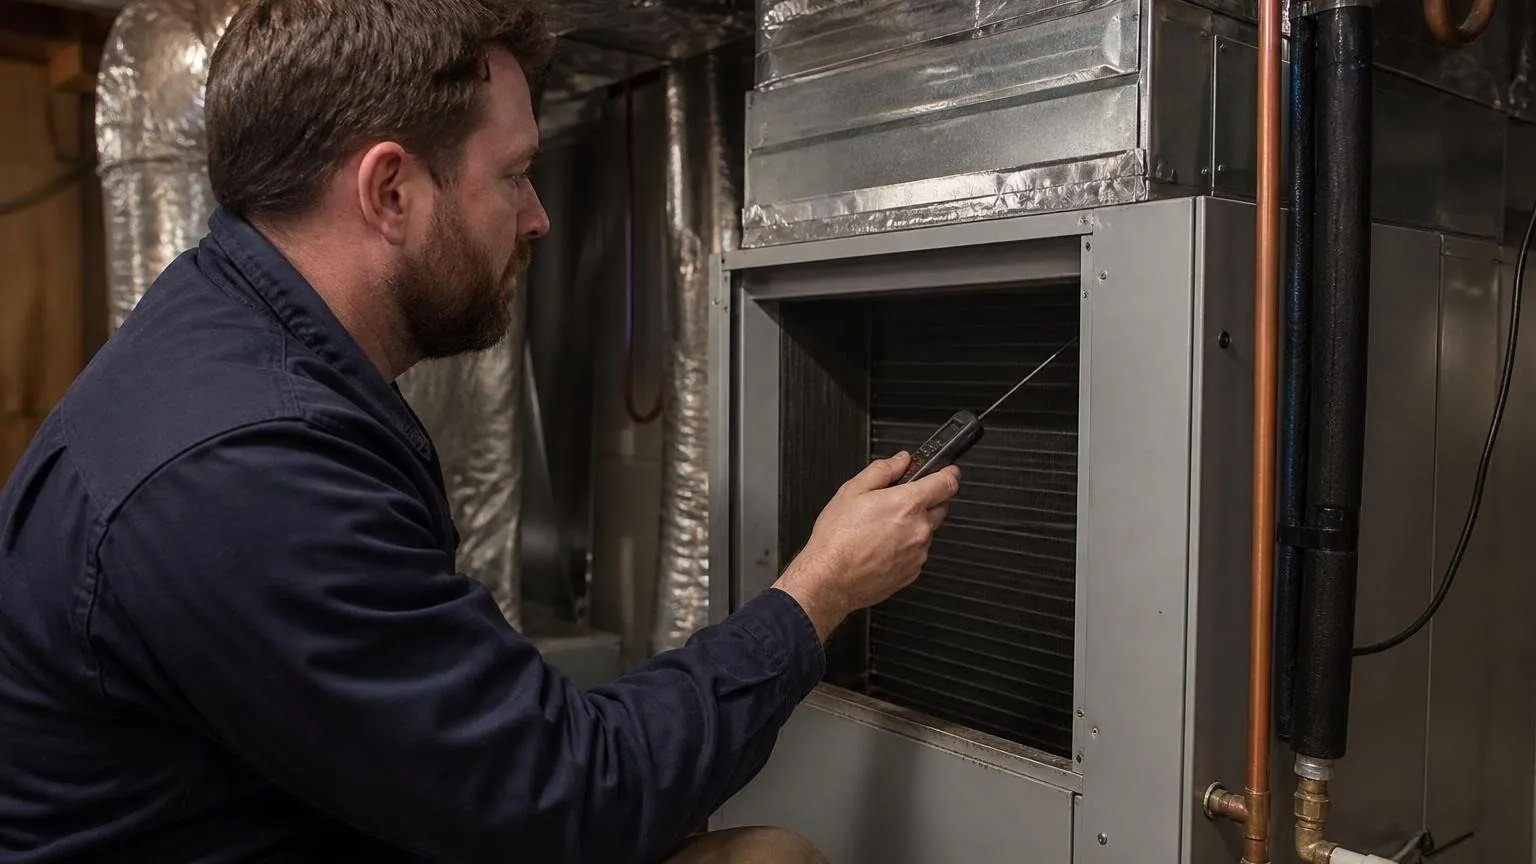
What is a psychrometric chart? A psychrometric chart is a graph of moist air at one barometric pressure. Plot any two known properties, such as dry bulb and wet bulb, and that single point gives you relative humidity, dew point, moisture content, enthalpy and specific volume.
Key Takeaways
- Our chart is computed from the ASHRAE Fundamentals (2017) chapter 1 equations in PsychroLib at 14.696 psia.
- The federal test method in 10 CFR 430 Appendix M, Table 5 sets 80°F dry bulb and 67°F wet bulb indoor entering air: 51.1% relative humidity, 60.3°F dew point.
- The 1.08, 0.68 and 4.5 load factors come from standard air at 0.075 lb/ft³, defined in the same appendix.
- A coil taking 1,200 CFM from 80°F/67°F to 58°F/56°F removes 41,358 Btu/h (3.45 tons) at a 0.69 sensible heat ratio, per our ASHRAE eqn 30 calculation.
- At 5,280 feet the standard atmosphere drops to 12.1 psia, so the sea level 1.08 factor falls to 0.89 (our calculation from ASHRAE equation 3).
- Our equations reproduce Penn State Extension’s worked examples within a gridline.
What does a psychrometric chart show?
A psychrometric chart shows seven properties of an air and water vapor mixture at a fixed pressure. Dry bulb temperature runs along the bottom, humidity ratio runs up the right side, and the curved top edge is saturation, where relative humidity is 100%. Fix any two independent properties and the other five follow.
The chart is only valid for the pressure it was drawn at. Ours uses 14.696 psia, which is one standard atmosphere (101,325 Pa) divided by 6,894.757 Pa per psi, both conversion factors from NIST Special Publication 811.
| Property | How it appears on the chart | IP unit |
|---|---|---|
| Dry bulb temperature | Near vertical lines, scale along the bottom | °F |
| Humidity ratio | Horizontal lines, scale on the right | grains or lb of water per lb dry air |
| Relative humidity | Curves rising to the right; 100% is the saturation edge | % |
| Wet bulb temperature | Diagonals sloping down to the right from the saturation edge | °F |
| Dew point | Read horizontally left to the saturation edge | °F |
| Enthalpy | Diagonals almost parallel to wet bulb lines, separate scale | Btu per lb dry air |
| Specific volume | Steep diagonals sloping down to the right | ft³ per lb dry air |
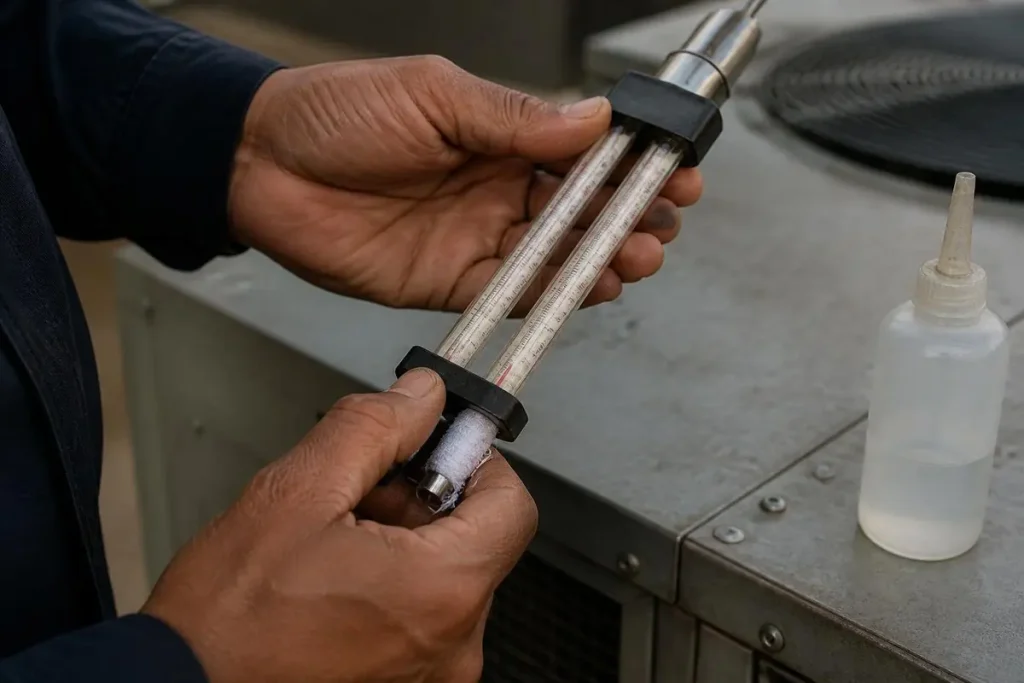
Penn State Extension notes that simple charts draw wet bulb and enthalpy as one line read off separate scales, while accurate charts draw them slightly apart. Along our 65°F wet bulb line, enthalpy rises about 0.2 Btu/lb. The wet bulb temperature explainer covers how that reading is taken in the field.
How do you read a psychrometric chart, step by step?
To read a psychrometric chart, mark where the lines of your two measured properties cross, then trace from that state point to each scale. Here is point A in Figure 1, the federal rating condition.
- Find 80°F on the bottom scale and go straight up.
- Follow the 67°F wet bulb line from the saturation edge down to the right until it crosses 80°F: that is the state point.
- Go horizontally right to the humidity ratio scale: 78.2 grains per pound of dry air.
- Go horizontally left to the saturation edge for the dew point: 60.3°F.
- Interpolate between the relative humidity curves: 51.1%.
- Read enthalpy and specific volume from their diagonals: 31.4 Btu/lb and 13.8 ft³/lb.
The 80°F/67°F pair is written out in the legacy Appendix M. The current Appendix M1 incorporates AHRI 210/240-2024 and points to that standard’s rating table, so check the edition you quote.
Check your method against a known answer. Penn State Extension reads 78°F dry bulb and 65°F wet bulb as 50 percent relative humidity, a 58°F dewpoint and about 0.0104 lb per lb. Our equations give 49.9%, 57.8°F and 0.0102.
Which equations draw the psychrometric chart?
Five ASHRAE Fundamentals (2017) chapter 1 equations draw every line; PsychroLib, described in the Journal of Open Source Software (2019), publishes them as code. Our own script uses t in °F, p in psia and W in lb per lb.
- Saturation vapor pressure: the Hyland and Wexler fit (ASHRAE eqn 6 above freezing).
- Humidity ratio: W = 0.621945 × pw / (p minus pw) (eqn 20).
- Enthalpy: h = 0.240t + W(1061 + 0.444t) Btu/lb (eqn 30).
- Specific volume: v = 0.370486 × (t + 459.67) × (1 + 1.607858W) / p (eqn 26).
- Pressure at altitude Z feet: p = 14.696 × (1 minus 0.0000068754Z) raised to 5.2559 (eqn 3).
Five common HVAC states, computed at sea level:
| State | DB °F | WB °F | RH % | Dew point °F | Grains/lb | Enthalpy Btu/lb | Volume ft³/lb |
|---|---|---|---|---|---|---|---|
| A. AHRI rating entering air | 80 | 67.0 | 51.1 | 60.3 | 78.2 | 31.4 | 13.8 |
| B. Room at 75°F, 50% RH | 75 | 62.6 | 50.0 | 55.1 | 64.6 | 28.1 | 13.7 |
| C. Air leaving a wet coil | 58 | 56.0 | 88.6 | 54.7 | 63.6 | 23.8 | 13.2 |
| D. Summer outdoor air | 95 | 75.0 | 39.8 | 66.8 | 98.5 | 38.3 | 14.3 |
| E. Winter outdoor air | 40 | 37.5 | 80.0 | 34.3 | 29.0 | 14.1 | 12.7 |
Correction: SI and IP enthalpy do not convert one to one
Some chart guides divide SI enthalpy by 2.326, the NIST kJ/kg to Btu/lb factor, getting about 21.6 Btu/lb for 77°F at 50% RH. The IP equation gives 29.3 Btu/lb, because IP enthalpy is zero at 0°F and SI at 0°C. Differences between states convert cleanly; absolute readings do not.
How do HVAC processes move across the psychrometric chart?
Every HVAC process is a path between two state points: horizontal moves change temperature only, vertical moves change moisture only, diagonals change both.
- Sensible heating, E to E2. Air at 40°F and 80% RH heated to 65°F keeps its 29.0 grains, so relative humidity falls to 31.9% (Penn State reads about 32 percent).
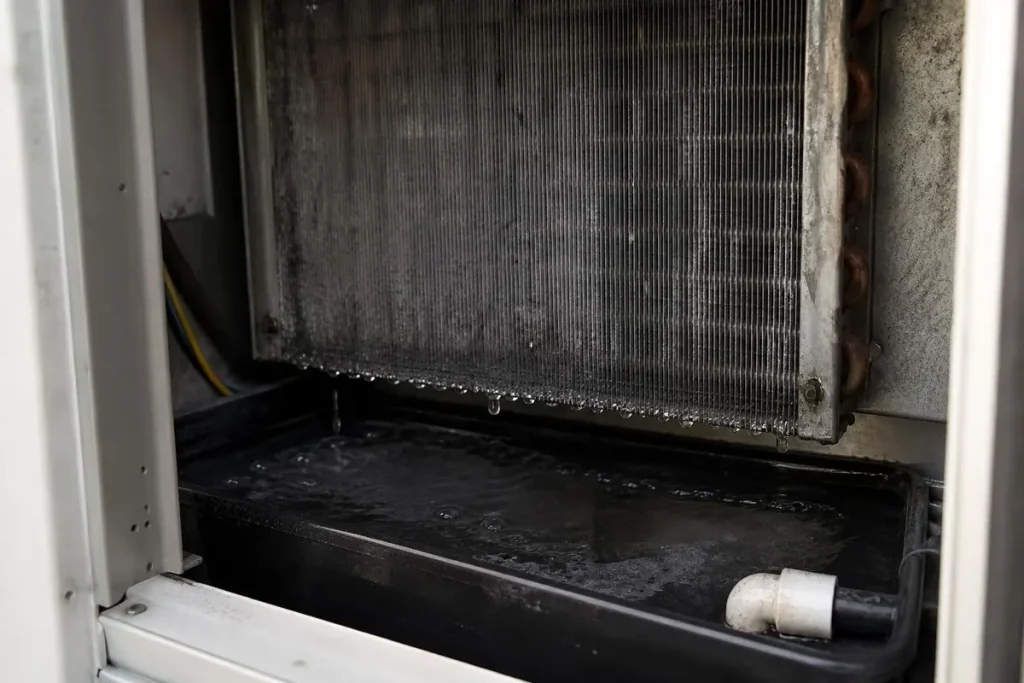
- Cooling and dehumidifying, A to C. Air crossing a wet coil falls from 80°F to 58°F and from 78.2 to 63.6 grains. The 22°F drop is the temperature split across the coil a technician measures.
- Mixing, D plus B to M. Mixing 25% outdoor air at 95°F dry bulb and 75°F wet bulb with 75% room air at 75°F and 50% RH, by mass, lands on the line between them at 80.0°F, 73.1 grains and 66.0°F wet bulb, 1°F of wet bulb from the rating condition. Ventilation load like this is what a dedicated outdoor air system handles.
- Evaporative cooling, F to G. Dry 95°F air at 18.1% RH follows its 65°F wet bulb line to 70°F, a 25°F drop, gaining 40.1 grains. Air at 95°F with a 75°F wet bulb, at the same 5°F approach, only reaches 80°F: the physics behind the swamp cooler climate rule.
- Humidification, H1 to H2. Raising 70°F air from 20% to 35% RH adds 16.4 grains per pound, or 10.5 lb of water per hour at 1,000 CFM, a load a whole house humidifier must meet.
The EPA mold guide advises keeping indoor humidity below 60 percent, ideally between 30 and 50 percent, hence state B at 50%. Our ideal indoor humidity guide covers seasonal targets.
How do you turn psychrometric chart readings into Btu per hour?
Multiply airflow by the change you read off the chart: sensible load = 1.08 × CFM × ΔT, latent load = 0.68 × CFM × Δgrains, and total load = 4.5 × CFM × Δh. Each factor is standard air density, 0.075 lb/ft³ per 10 CFR 430 Appendix M, times 60 minutes, times a property.
- Sensible: 60 × 0.075 × 0.240 = 1.08.
- Latent: 60 × 0.075 × 1061 / 7,000 grains per pound = 0.68.
- Total: 60 × 0.075 = 4.5.
The 7,000 grains per pound follows from NIST’s grain and pound definitions. For process A to C at 1,200 CFM: sensible 28,512 Btu/h, latent 11,930 Btu/h, total 41,358 Btu/h by enthalpy.
The methods differ by about 2% because 1.08 ignores heat carried by water vapor. At 12,000 Btu/h per ton (NIST), that is 3.45 tons at a sensible heat ratio of 0.69. A room BTU calculator does not capture that latent share, and airflow per ton is the lever that shifts it.
Does a psychrometric chart change with altitude?
Yes. A psychrometric chart is drawn for one pressure, and at 5,280 feet the ASHRAE standard atmosphere gives 12.1 psia, about 18% below sea level, so each CFM carries less heat.
Scaled by pressure, the load factors become 0.89 sensible, 0.56 latent and 3.71 total. Air at 75°F and 50% RH holds 78.8 grains per pound there, against 64.6 at sea level. Even 2,000 feet gives 13.66 psia, 7% low, so set your chart or software to site pressure.
Why do technicians still need the psychrometric chart?
The chart shows moisture and energy that a refrigerant gauge cannot. A correct superheat and subcooling charge can still leave a house clammy if the coil removes too few grains.
If the room sits above the EPA’s 60 percent ceiling while the split looks normal, the latent load is winning, and a dehumidifier may be a more direct fix than a larger air conditioner.
How we researched this
Research date: October 2026. We opened ten sources and cited seven. Every chart line and table value comes from our own script using the ASHRAE Fundamentals (2017) chapter 1 equations published in PsychroLib, checked against Penn State Extension’s examples. Rating conditions and standard air density come from the eCFR text of 10 CFR 430; unit conversions from NIST SP 811. We excluded Wikipedia, chart download pages and two engineering blogs whose numbers were unsourced or wrong (see the correction box). No Reddit: this is engineering method, not opinion.
Frequently asked questions
What is a psychrometric chart used for in HVAC?
It turns two air measurements into moisture and energy content, which is how coils, humidifiers and ventilation are sized. Air at 80°F dry bulb and 67°F wet bulb, the rating condition in 10 CFR 430 Appendix M, reads 78.2 grains per pound and 31.4 Btu/lb at sea level.
How many readings do you need to use a psychrometric chart?
Two independent properties, usually dry bulb with wet bulb or with relative humidity; dry bulb with dew point also works. Wet bulb and enthalpy together do not fix a point, because their lines run almost parallel, about 0.2 Btu/lb apart along a wet bulb line.
How do you find dew point on a psychrometric chart?
From the state point, move horizontally left at constant humidity ratio to the saturation curve and read the temperature. Air at 80°F with a 67°F wet bulb has a 60.3°F dew point, so a duct or pipe colder than that will sweat.
Why are enthalpy values different on SI and IP charts?
IP enthalpy is zero at 0°F and SI enthalpy at 0°C, so dividing an SI reading by NIST’s 2.326 factor understates the IP value. At 77°F and 50% RH the IP equation gives 29.3 Btu/lb, not 21.6. Enthalpy differences still convert correctly.
Can I use a sea level psychrometric chart at high altitude?
Only as a rough guide. At 5,280 feet the ASHRAE standard atmosphere is 12.1 psia, so the 1.08 sensible factor becomes 0.89 and 75°F air at 50% RH carries 78.8 grains per pound instead of 64.6. Design work needs a chart set to site pressure.
Where do the 1.08, 0.68 and 4.5 factors come from?
Each is standard air density, 0.075 lb/ft³ per 10 CFR 430 Appendix M, times 60 minutes, times a property: 0.240 Btu/lb°F for sensible, 1061 Btu/lb divided by 7,000 grains for latent, and enthalpy directly for total, giving 1.08, 0.68 and 4.5.
Sources
- D. Meyer and D. Thevenard. “PsychroLib” source code, implementing ASHRAE Handbook Fundamentals (2017) chapter 1. https://github.com/psychrometrics/psychrolib. Accessed October 2026.
- Journal of Open Source Software. “PsychroLib: a library of psychrometric functions to calculate thermodynamic properties of air.” https://joss.theoj.org/papers/10.21105/joss.01137. Accessed October 2026.
- eCFR. “10 CFR Part 430, Subpart B, Appendix M: Uniform Test Method for Measuring the Energy Consumption of Central Air Conditioners and Heat Pumps.” https://www.ecfr.gov/current/title-10/chapter-II/subchapter-D/part-430/subpart-B/appendix-Appendix%20M%20to%20Subpart%20B%20of%20Part%20430. Accessed October 2026.
- eCFR. “10 CFR Part 430, Subpart B, Appendix M1.” https://www.ecfr.gov/current/title-10/chapter-II/subchapter-D/part-430/subpart-B/appendix-Appendix%20M1%20to%20Subpart%20B%20of%20Part%20430. Accessed October 2026.
- NIST. “NIST Guide to the SI, Appendix B.8: Factors for Units Listed Alphabetically.” https://www.nist.gov/pml/special-publication-811/nist-guide-si-appendix-b-conversion-factors/nist-guide-si-appendix-b8. Accessed October 2026.
- U.S. EPA. “A Brief Guide to Mold, Moisture and Your Home.” https://www.epa.gov/mold/brief-guide-mold-moisture-and-your-home. Accessed October 2026.
- Penn State Extension. “Psychrometric Chart Use.” https://extension.psu.edu/psychrometric-chart-use. Accessed October 2026.
Leave a Reply