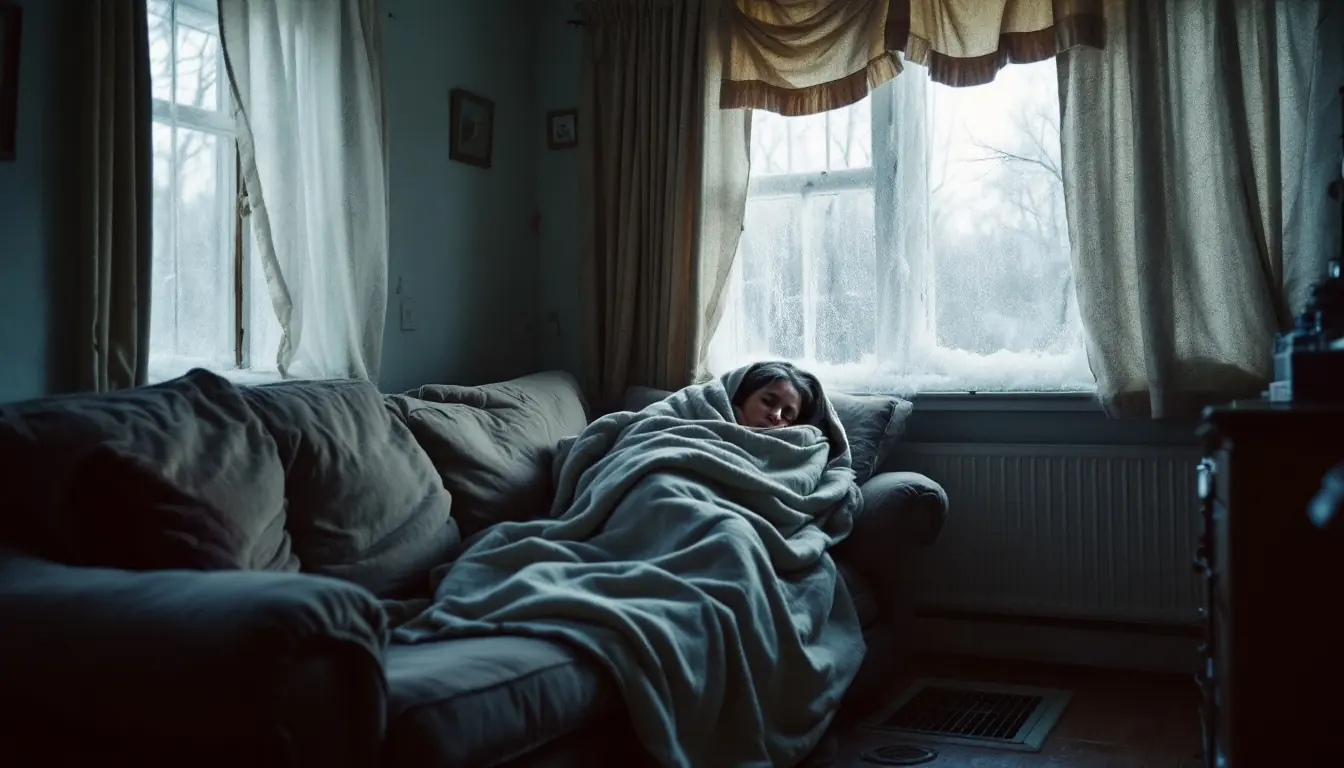
Every two years the American Housing Survey, run by the Census Bureau for HUD, asks each sampled household whether last winter the home was so cold for 24 hours or more that it was uncomfortable, and if so, why. This report analyses the 2023 answers household by household, with replicate-weight standard errors, and compares them with the four previous surveys.
Last reviewed: November 2026 · By the HVAC Brief Editorial Team · Our sourcing and editorial standards
9.97 million households said they were uncomfortably cold for at least a day. The most common reason was not the price of fuel but the heating equipment breaking down.
Executive summary
In the 2023 American Housing Survey, 9.97 million US households said their home had been uncomfortably cold for 24 hours or more during the previous winter, 7.8% of the 127.6 million homes with heating equipment whose residents lived there that winter (standard error 0.17 points). That was the winter before the 2023 interview, for most households 2022 to 2023.
Equipment breakdown was the leading cause, named by 34.2% of cold households (3.41 million). Utility interruptions followed at 27.8%. The cost of heating was named by only 9.3%. 22.5% of households with a breakdown had four or more.
Cold homes track the building and the household’s means more than the climate. Renters were cold at 10.3% against 6.6% for owners, and households below the poverty line at 11.2% against 5.8% for those at four times the poverty line or more. The West North Central states, with some of the coldest winters in the country, were at 5.3%, half the West South Central rate.
The rate was 8.7% in the 2015 survey, fell to 6.2% in 2017 and 6.6% in 2019, rose to 9.4% in 2021, the survey that covers the February 2021 Texas freeze, and eased to 7.8% in 2023.
Key findings
- 9.97 million US households (7.8%) were uncomfortably cold at home for 24 hours or more last winter (AHS 2023; 95% interval 7.5 to 8.2%).
- Leading cause: heating equipment breakdown, 3.41 million households, 34.2% of cold households.
- Renters: 10.3% cold; owners: 6.6%.
- Main heat from portable electric heaters: 19.8% cold. Electric heat pump: 5.5%. Forced-air furnace: 7.0%. Boiler: 11.1%.
- Homes built before 1940: 12.2%; homes built in 2010 or later: 4.7%.
- Below the poverty line: 11.2%; 400% of poverty or more: 5.8%.
- Households with a power outage in the past 12 months: 13.9% cold, about 2.5 times the 5.5% rate for those without one.
What the survey asks, and who is counted
In 2023, 46,548 sample households with heating equipment that lived in the home the previous winter answered whether the home was so cold for 24 hours or more that it was uncomfortable. Those who said yes are asked about causes: equipment breakdown (and how many breakdowns lasted six hours or more), utility interruption, inadequate heating capacity, inadequate insulation, the cost of heating, or something else.
The base for every share is the 127.6 million homes that answered yes or no, excluding 5.17 million households that had not lived in the home the previous winter and 0.51 million homes recorded as having no heating equipment, out of 133.2 million occupied homes.
Why homes get cold: causes
| Cause | Households | Share of cold households | Std. error (pts) |
|---|---|---|---|
| Equipment breakdown | 3.41 million | 34.2% | ±0.9 |
| Utility interruption | 2.77 million | 27.8% | ±1.0 |
| Inadequate heating capacity | 1.56 million | 15.6% | ±0.8 |
| Inadequate insulation | 1.49 million | 14.9% | ±0.7 |
| Other | 1.43 million | 14.4% | ±0.7 |
| Cost of heating | 0.92 million | 9.3% | ±0.6 |
Households could report more than one cause. Source: Census/HUD American Housing Survey 2023; HVAC Brief analysis.
A breakdown is a service call; a utility interruption is a supply event no contractor can fix (see why a furnace may not restart after a power outage). Only 0.92 million households named the cost of heating; EIA’s questions on bills and disconnections give larger numbers (household energy insecurity).
Repeat breakdowns
| Breakdowns | Share of households |
|---|---|
| No breakdown lasted 6 hours | 2.0% |
| 1 | 52.4% |
| 2 | 17.2% |
| 3 | 6.0% |
| 4 or more | 22.5% |
Half the households whose heating broke down had one long breakdown; 22.5%, about 0.77 million, had four or more in one winter. See what fails in a furnace.
Renters and owners
| Group | Households with heat | Cold 24+ hours | Share cold | Std. error | Cold from breakdown, per 100 |
|---|---|---|---|---|---|
| Owner | 85.3M | 5.64M | 6.6% | ±0.2 | 2.0 |
| Renter | 40.4M | 4.16M | 10.3% | ±0.3 | 4.2 |
| Occupied without rent | 1.8M | 0.17M | 9.5% | ±1.5 | 1.9 |
Renters were cold at 10.3%, more than one and a half times the owner rate of 6.6%. Renters are 31.7% of households with heat and 41.8% of cold ones. The gap is widest for breakdowns: 4.2 in every 100 renting households were cold because the equipment failed, about twice the owner rate of 2.0. Renters also live in older, leakier homes (renters vs homeowners), and many cities set landlord heat requirements.
Cold homes by heating system and fuel
| Group | Households with heat | Cold 24+ hours | Share cold | Std. error | Cold from breakdown, per 100 |
|---|---|---|---|---|---|
| Forced warm-air furnace | 86.5M | 6.04M | 7.0% | ±0.2 | 2.3 |
| Steam or hot water (boiler) | 10.6M | 1.18M | 11.1% | ±0.7 | 5.3 |
| Electric heat pump | 14.5M | 0.80M | 5.5% | ±0.4 | 1.9 |
| Electric baseboard | 5.0M | 0.48M | 9.7% | ±0.9 | 3.1 |
| Floor, wall or pipeless furnace | 5.3M | 0.64M | 12.0% | ±0.9 | 3.9 |
| Portable electric heater | 2.3M | 0.45M | 19.8% | ±1.6 | 6.5 |
Source: Census/HUD American Housing Survey 2023; HVAC Brief analysis.
Homes that rely mainly on portable electric heaters were cold at 19.8%, nearly three times the furnace rate. Portable heaters often signal a home with no working central system, and carry fire risk (see space heater cost and safety and home heating fire statistics). Boilers, common in older apartment buildings, had the highest breakdown rate of any major system, 5.3 per 100 households. Smaller groups (room heaters, wood stoves, fireplaces) ranged from 9 to 11 percent on small samples.
Heat pump homes had the lowest rate of any main system, 5.5% (standard error 0.4). That is not proof that heat pumps keep homes warmer, since they are concentrated in the mild South and in newer homes, but there is no sign that heat pump households were colder than furnace households. See do heat pumps work in cold weather.
By fuel, electricity (7.7%) and piped gas (7.6%) homes were cold at almost the same rate. Fuel oil (9.8%), propane (9.5%) and wood (9.4%) homes were somewhat higher, with standard errors around one point.
Mobile homes, apartments and houses
| Group | Households with heat | Cold 24+ hours | Share cold | Std. error | Cold from breakdown, per 100 |
|---|---|---|---|---|---|
| Mobile home | 6.9M | 0.78M | 11.3% | ±0.9 | 3.0 |
| Single-family detached | 83.1M | 5.98M | 7.2% | ±0.2 | 2.1 |
| Single-family attached | 7.8M | 0.52M | 6.7% | ±0.5 | 2.9 |
| 2 to 4 units | 8.4M | 0.81M | 9.6% | ±0.5 | 3.7 |
| 5 to 19 units | 10.1M | 0.94M | 9.3% | ±0.6 | 4.1 |
| 20 or more units | 11.1M | 0.93M | 8.3% | ±0.5 | 4.2 |
Mobile homes had the highest rate of any building type, 11.3%, and among mobile home households below twice the poverty line it reached 13.6% (standard error 1.4). Our mobile home furnace guide covers replacement rules. Apartments of all sizes had higher breakdown rates than single-family houses.
Cold homes by age of the home
| Group | Households with heat | Cold 24+ hours | Share cold | Std. error | Cold from breakdown, per 100 |
|---|---|---|---|---|---|
| Before 1940 | 15.6M | 1.89M | 12.2% | ±0.5 | 4.4 |
| 1940 to 1959 | 17.5M | 1.82M | 10.4% | ±0.5 | 3.9 |
| 1960 to 1979 | 31.1M | 2.59M | 8.3% | ±0.3 | 3.0 |
| 1980 to 1999 | 32.3M | 2.04M | 6.3% | ±0.3 | 1.9 |
| 2000 to 2009 | 17.1M | 0.97M | 5.7% | ±0.3 | 1.7 |
| 2010 or later | 14.0M | 0.66M | 4.7% | ±0.4 | 1.6 |
Source: Census/HUD American Housing Survey 2023; HVAC Brief analysis.
The rate falls with every newer group, from 12.2% for homes built before 1940 to 4.7% for those built since 2010. The insulation gap by age of home is in our home insulation statistics.
Income and poverty
| Group | Households with heat | Cold 24+ hours | Share cold | Std. error | Cold from breakdown, per 100 |
|---|---|---|---|---|---|
| Below poverty line | 16.8M | 1.89M | 11.2% | ±0.5 | 4.0 |
| 100 to 199% of poverty | 19.9M | 1.96M | 9.8% | ±0.4 | 3.5 |
| 200 to 399% | 37.0M | 2.98M | 8.1% | ±0.3 | 2.7 |
| 400% or more | 53.9M | 3.15M | 5.8% | ±0.2 | 2.0 |
Households below the poverty line were cold at 11.2%, nearly twice the rate of those at four times the poverty line or more (5.8%). By income, rates fall from 10.8% under $25,000 to 5.8% at $150,000 or more. Renters below the poverty line were cold at 12.5%, against 5.1% for owners at four times the poverty line or more. The federal Low Income Home Energy Assistance Program and the Weatherization Assistance Program are aimed at households like these.
Cold homes by region
| Group | Households with heat | Cold 24+ hours | Share cold | Std. error | Cold from breakdown, per 100 |
|---|---|---|---|---|---|
| West South Central | 15.2M | 1.60M | 10.5% | ±0.5 | 2.8 |
| Pacific | 18.6M | 1.79M | 9.7% | ±0.6 | 2.7 |
| New England | 6.0M | 0.54M | 9.0% | ±0.7 | 3.2 |
| East South Central | 7.9M | 0.69M | 8.8% | ±0.9 | 2.4 |
| East North Central | 18.9M | 1.66M | 8.8% | ±0.5 | 2.9 |
| Middle Atlantic | 16.6M | 1.39M | 8.4% | ±0.5 | 4.1 |
| West North Central | 8.7M | 0.46M | 5.3% | ±0.7 | 1.7 |
| Mountain | 9.6M | 0.51M | 5.3% | ±0.5 | 2.0 |
| South Atlantic | 26.1M | 1.33M | 5.1% | ±0.3 | 2.0 |
Source: Census/HUD American Housing Survey 2023; HVAC Brief analysis.
The ranking does not follow the thermometer. The West South Central division (Texas, Oklahoma, Louisiana, Arkansas) was highest at 10.5%, then the Pacific at 9.7%. The West North Central states, from Minnesota to Kansas, were at 5.3%. In the West South Central, 5.2 in 100 households were cold because of a utility interruption (standard error 0.4), the highest of any division. In the Pacific, 2.5 in 100 were cold because of the cost of heating (standard error 0.3), against 0.7 nationally. Homes in cold climates are built for cold; milder regions may have less margin when a cold snap arrives.
Who lives in cold homes
Householders under 35 were cold at 9.0%, those 75 or older at 6.3%. Households with someone aged 65 or older were cold at 7.0%, below the 8.2% rate for other households (standard errors about 0.25), likely because they are more often owners, though the 2.86 million cold households with an older member are among the most vulnerable. Households with a child under six were cold at 8.7%. Black householders (10.3%) and Hispanic householders (9.7%) were cold more often than non-Hispanic white householders (6.8%), gaps that overlap with tenure, income and housing age. Metro and non-metro households were cold at the same rate (7.8% and 7.8%).
Power outages and cold homes
| Group | Share cold | Std. error | Cold from breakdown, per 100 | Cold from utility interruption, per 100 |
|---|---|---|---|---|
| Power outage in last 12 months | 13.9% | ±0.6 | 4.2 | 6.3 |
| No power outage | 5.5% | ±0.2 | 2.1 | 0.7 |
Half the 2023 sample was asked whether the home lost power completely in the past twelve months. Those that had were cold last winter at 13.9%, against 5.5% for households that had not, about 2.5 times the rate. The periods differ and outage-prone areas differ in other ways, so this is an association, not proof of cause. Almost all central heating, including gas furnaces, needs electricity to run. Outage trends by state are in our power outage statistics by state, and generators used during outages are the leading consumer product in carbon monoxide deaths.
Original synthesis (HVAC Brief calculations)
1. A decade of cold homes: weather years show through
| Survey | Cold households | Share | Margin of error (90%) | Equipment breakdown | Utility interruption* | Cost of heating* |
|---|---|---|---|---|---|---|
| 2015 | 9.65 million | 8.7% | ±0.31M | 3.39 million | 1.40 million | 1.02 million |
| 2017 | 6.99 million | 6.2% | ±0.26M | 2.52 million | 1.27 million | 0.59 million |
| 2019 | 7.51 million | 6.6% | ±0.28M | 2.89 million | 1.53 million | 0.53 million |
| 2021 | 11.35 million | 9.4% | ±0.37M | 3.18 million | 4.63 million | 0.44 million |
| 2023 | 9.97 million | 7.8% | ±0.36M | 3.41 million | 2.51 million | 0.86 million |
*Utility interruption and cost of heating counted among households that did not report an equipment breakdown, the only definition available in every year. Source: AHS table specifications 2015 to 2021; AHS 2023 PUF.
The 2021 survey, which asked about the winter of 2020 to 2021, stands out for utility interruptions: 4.63 million households, three times the 2019 figure. That winter included the February 2021 storm that left millions of Texans without power. The 2023 count, 2.51 million, remains above the 2015 to 2019 range. Equipment breakdowns have been steadier, between 2.5 and 3.4 million households in every survey. Cost of heating as a cause was 1.02 million in 2015 and 0.86 million in 2023.
2. Cold homes are an equipment and building problem more than a climate problem
The groups with the highest rates have the oldest buildings (12.2% for pre-1940 homes), the weakest heating (portable heaters 19.8%, mobile homes 11.3%) and the least control over repairs (renters 10.3%). Breakdowns, inadequate capacity and poor insulation (3.4 million, 1.6 million and 1.5 million households, with overlap) are fixable. The cost of fuel, the focus of most winter coverage, is the smallest named cause. Breakdowns left 2.1 times as many renters as owners cold per 100 households, against a ratio of 1.6 for being cold overall.
3. Scale for the trade
About 3.4 million households went 24 hours or more uncomfortably cold because the heat broke down, and the survey counts at least 6.6 million breakdowns of six hours or more among them (counting four or more as four), a floor on long no-heat events in one season. See our guide to emergency HVAC service; the HVAC replacement cost report shows what homeowners paid when repair was no longer an option.
Charts worth building from this data
- Stacked bar of cold households by cause, renters vs owners.
- Line chart of the share uncomfortably cold, AHS 2015 to 2023, with margins of error.
- Map of the share uncomfortably cold by Census division.
- Dot plot of the share cold by main heating equipment with 95% intervals.
Most quotable statistics
- 9.97 million US households were uncomfortably cold at home for 24 hours or more last winter (Census/HUD American Housing Survey 2023, HVAC Brief analysis).
- The leading cause of cold homes is broken heating equipment: 3.41 million households, 34.2% of those who were cold.
- Renters were uncomfortably cold at home at 10.3%, against 6.6% of homeowners (AHS 2023).
- Households that lost power in the past year were about 2.5 times as likely to have been cold at home (13.9% against 5.5%).
Data limitations
- The measure is self-reported discomfort for 24 hours or more, not measured indoor temperature.
- “Last winter” is the winter before the interview, for most 2023 respondents 2022 to 2023.
- In 2023 most households reporting a breakdown were not asked the other cause questions, so those counts are lower bounds. The trend uses the definition available every year: other causes among households without a breakdown.
- Households could report more than one cause. The 2015 table is weighted to the 2010 Census, the 2021 and 2023 tables to the 2020 Census.
- Group differences are associations; tenure, income, age of home, heating type and region overlap and are not separated here.
- Groups marked * rest on fewer than 400 sample homes. The outage question covers the previous 12 months and was asked of half the sample.
Downloadable dataset: recommended fields
| Field | Description |
|---|---|
| group | Cut and category |
| households_with_heat_k | Base: occupied homes with heat, lived in last winter (thousands) |
| cold_k | Households uncomfortably cold 24+ hours (thousands) |
| share_cold | Weighted share cold |
| se_share | Replicate-weight standard error |
| cause | Equipment breakdown, utility interruption, capacity, insulation, cost, other |
| cause_per_100 | Cold from each cause per 100 households in the group |
| breakdowns | Number of breakdowns of 6 hours or more |
Press summary
9.97 million US households, 7.8% of those with heat, were uncomfortably cold at home for 24 hours or more last winter, and the most common reason was broken heating equipment, according to an HVAC Brief analysis of the Census Bureau’s American Housing Survey. Renters were cold at 10.3% against 6.6% of owners, and only 9.3% of cold households named the cost of heating.
Suggested headlines
- Nearly 10 million US households were too cold at home last winter. Broken heat was the top reason
- Renters are far more likely than owners to spend a winter day too cold at home
- The coldest homes are not in the coldest states
- Lost power in the past year? You were 2.5 times as likely to be cold at home
Source quality ranking
| Source | Tier | Why |
|---|---|---|
| Census/HUD American Housing Survey 2023, national public use file | Tier 1 | Federal household survey; household-level answers with 160 replicate weights |
| AHS table specifications 2015, 2017, 2019, 2021 and 2023 | Tier 1 | Published estimates and margins of error used for the trend and to verify totals |
| Advocacy surveys of energy hardship | Excluded | Different questions and samples; not combined with AHS |
Methodology
- Source: AHS 2023 National PUF, household file (COLD and its cause variables, crossed with TENURE, HEATTYPE, HEATFUEL, BLD, DIVISION, PERPOVLVL, HINCP, YRBUILT, household age and composition, OMB13CBSA, race, ethnicity and OUTAGE). Codes from the AHS 2023 Value Labels Package.
- Universe: occupied interviews with COLD of 1 (yes) or 2 (no), 127.6 million households, as in Census table C-05-AO. Our totals reproduce the published 9,971 thousand and every published cause count.
- Weighted with WEIGHT; standard errors from the 160 replicate weights (variance = 4/160 x sum of squared replicate deviations). 90 percent margin of error = 1.645 standard errors.
- Trend: AHS 2015 to 2021 table specifications (Housing Quality). Share = cold / (cold + not cold).
Frequently asked questions
How many US households are too cold at home in winter?
9.97 million households, 7.8% of those with heating, were uncomfortably cold for 24 hours or more last winter (AHS 2023).
What is the most common reason homes get too cold?
Heating equipment breaking down. 3.41 million households, 34.2% of those who were cold, named a breakdown, followed by utility interruptions (2.77 million).
Are renters more likely to have a cold home?
Yes. 10.3% of renters were uncomfortably cold for 24 hours or more, against 6.6% of owners.
How many people can’t afford to heat their home?
In the AHS, 0.92 million households said the cost of heating was a reason their home was uncomfortably cold. EIA’s hardship questions on bills and disconnections give larger numbers.
Which heating systems leave homes coldest?
Homes heated mainly with portable electric heaters, 19.8%. Heat pumps (5.5%) and furnaces (7.0%) were lowest.
Are older homes colder?
Yes. 12.2% of households in homes built before 1940 were uncomfortably cold, falling to 4.7% in homes built since 2010.
Which region has the most cold homes?
The West South Central division (Texas, Oklahoma, Louisiana, Arkansas), at 10.5%, followed by the Pacific at 9.7%.
Are mobile homes colder than houses?
Yes. 11.3% of mobile home households were uncomfortably cold, against 7.2% in detached single-family houses.
Is the number of cold homes rising?
Not steadily. The share was 8.7% in 2015, 6.2% in 2017, 6.6% in 2019, 9.4% in 2021 and 7.8% in 2023.
Do power outages make homes cold?
They are a major cause. 2.77 million cold households named a utility interruption, and households that lost power in the past year were cold at 13.9% against 5.5%.
Cite this report
Sources
- US Census Bureau and HUD, American Housing Survey 2023, National Public Use File, household file.
- AHS 2023 Table Specifications and PUF Estimates for User Verification (Housing Quality, table C-05-AO); AHS 2023 Value Labels Package.
- AHS table specifications, 2015, 2017, 2019 and 2021.
- AHS technical documentation: definitions and accuracy of the data, replicate weights.
The HVAC Brief is an independent trade publication. We do not sell equipment, take manufacturer advertising, or accept payment for placement in our research. Corrections welcome.
Leave a Reply