
What is the cost to run heat pump systems in a typical US home? About $1,015 a year for heating and cooling combined, or roughly $85 a month, based on EIA’s 2020 household usage priced at each state’s August 2026 residential electricity rate.
Key Takeaways
- Heat pump homes used a mean 3,116 kWh for heating and 3,119 kWh for cooling in 2020, fans included (EIA RECS 2020).
- The typical (median) heat pump home used 5,423 kWh, which costs about $873 a year at its own state’s August 2026 rate (EIA RECS 2020; EIA Table 5.6.A).
- Of 23 states with at least 30 sampled homes, West Virginia ($1,603) and Pennsylvania ($1,594) cost the most to run; California ($659) cost the least (EIA Table 5.6.A).
- Split heat pumps made since January 1, 2023 must reach at least 7.5 HSPF2 and 14.3 SEER2 (10 CFR 430.32).
- Electric resistance backup gives about 3,400 Btu per kWh against 10,300 Btu for a 10.3 HSPF heat pump, DOE says, which is why strip heat drives winter spikes (DOE, archived copy).
- 45.3% of heat pump homes also ran secondary heating equipment in 2020, most often portable electric heaters (18.8%) or a fireplace (17.9%), per EIA RECS 2020.
What does it cost to run a heat pump for a year?
A mean of about $1,015 a year, or $85 a month, for heating and cooling together. That figure prices each home’s 2020 heat pump usage at its own state’s August 2026 residential rate. Priced instead at the 18.16 cent national average, the same usage would cost $1,132, because heat pump homes cluster in Southern states with cheaper power.
| Metric, US homes with heat pump main heat | Value | Source |
|---|---|---|
| Homes (sampled) | 17.19 million (2,372) | RECS 2020 microdata, HC6.1 |
| Share of all US homes | 13.9% | RECS 2020, HC6.1 |
| Heating electricity, incl. fan, mean | 3,116 kWh (SE 57) | RECS 2020 microdata |
| Cooling electricity, incl. fan, mean | 3,119 kWh (SE 72) | RECS 2020 microdata |
| Heating plus cooling, mean / median | 6,235 kWh (SE 96) / 5,423 kWh | RECS 2020 microdata |
| Cost in 2020, mean, EIA estimate | $731 | RECS 2020 microdata |
| Cost at own-state August 2026 rate, mean / median | $1,015 (SE 16) / $873 | RECS 2020; EIA Table 5.6.A |
| Cost at 18.16 cent US average, mean | $1,132 | RECS 2020; EIA Table 5.6.A |
EIA’s published Table HC6.1 counts 16.13 million central and 1.06 million ductless heat pump homes, matching our filter. Heat pumps were the main heat in 32.6% of East South Central homes and 31.0% of South Atlantic homes, against 3.0% in New England. For what the equipment itself costs, see our federal installed-cost estimates for heat pumps.
How much does it cost to run a heat pump in your state?
Between about $659 and $1,603 a year across the 23 states with enough sampled heat pump homes. Climate sets the kilowatt hours; the local rate sets the price. Current rates for every state are in our state electricity price tracker.
| State | Homes sampled | Heating kWh | Cooling kWh | Aug 2026 rate | Annual cost (SE) |
|---|---|---|---|---|---|
| West Virginia | 42 | 7,722 | 2,109 | 16.31¢ | $1,603 ($192) |
| Pennsylvania | 59 | 5,683 | 1,637 | 21.77¢ | $1,594 ($131) |
| Maryland | 73 | 4,413 | 2,189 | 21.40¢ | $1,413 ($102) |
| Delaware | 31 | 4,722 | 2,063 | 18.70¢ | $1,269 ($140) |
| Alabama | 95 | 3,631 | 3,265 | 16.33¢ | $1,126 ($74) |
| Missouri | 30 | 4,645 | 2,169 | 16.02¢ | $1,092 ($144) |
| Arizona | 129 | 1,199 | 5,850 | 15.05¢ | $1,061 ($57) |
| Kentucky | 97 | 5,415 | 2,120 | 13.80¢ | $1,040 ($64) |
| South Carolina | 139 | 3,096 | 3,496 | 15.76¢ | $1,039 ($53) |
| Virginia | 127 | 3,456 | 2,348 | 17.64¢ | $1,024 ($63) |
| Georgia | 116 | 2,901 | 3,383 | 15.90¢ | $999 ($55) |
| Oregon | 49 | 4,845 | 1,262 | 15.92¢ | $972 ($83) |
| Texas | 193 | 2,281 | 3,801 | 15.91¢ | $968 ($57) |
| Florida | 223 | 1,215 | 5,092 | 14.99¢ | $945 ($51) |
| Tennessee | 177 | 4,489 | 2,426 | 13.42¢ | $928 ($40) |
| Arkansas | 52 | 4,001 | 2,386 | 14.37¢ | $918 ($89) |
| North Carolina | 185 | 3,252 | 2,618 | 14.95¢ | $877 ($48) |
| Mississippi | 44 | 2,511 | 3,296 | 14.43¢ | $838 ($96) |
| New York | 34 | 1,876 | 1,022 | 28.65¢ | $830 ($119) |
| Washington | 60 | 4,854 | 734 | 14.63¢ | $818 ($85) |
| District of Columbia | 31 | 1,767 | 1,217 | 25.98¢ | $775 ($113) |
| Louisiana | 66 | 1,948 | 3,812 | 12.87¢ | $741 ($53) |
| California | 48 | 768 | 1,448 | 29.75¢ | $659 ($94) |
California pays the highest rate in the table, 29.75 cents, yet has the lowest bill, because its sampled heat pump homes used only 2,216 kWh. West Virginia’s homes used 9,831 kWh, mostly for heat. The other 28 states had fewer than 30 sampled heat pump homes and are left out rather than guessed.
Heating or cooling: which drives the bill in each climate?
Heating dominates in cold and marine climates, cooling in hot ones. In Building America Cold zones, heat pump homes used 5,822 kWh for heat and 1,449 for cooling; in Hot-Humid zones the split flips to 1,737 and 4,320.
| Climate zone | Homes sampled | Heating kWh | Cooling kWh | Cost at Aug 2026 rates |
|---|---|---|---|---|
| Cold | 265 | 5,822 | 1,449 | $1,412 |
| Mixed-Humid | 1,146 | 4,008 | 2,485 | $1,053 |
| Hot-Humid | 655 | 1,737 | 4,320 | $925 |
| Hot-Dry | 194 | 1,140 | 4,003 | $891 |
| Marine | 100 | 3,887 | 735 | $740 |
Cold-zone homes spent the most, $1,412 a year. The cooling half of these numbers is the heat pump running as an air conditioner; our cooling cost study for all air-conditioned homes covers that side for every system type. Very-Cold zones had only 7 sampled heat pump homes; our guide to cold-climate ratings explains what the 5°F test measures.
How to calculate the cost to run a heat pump from HSPF2 and SEER2
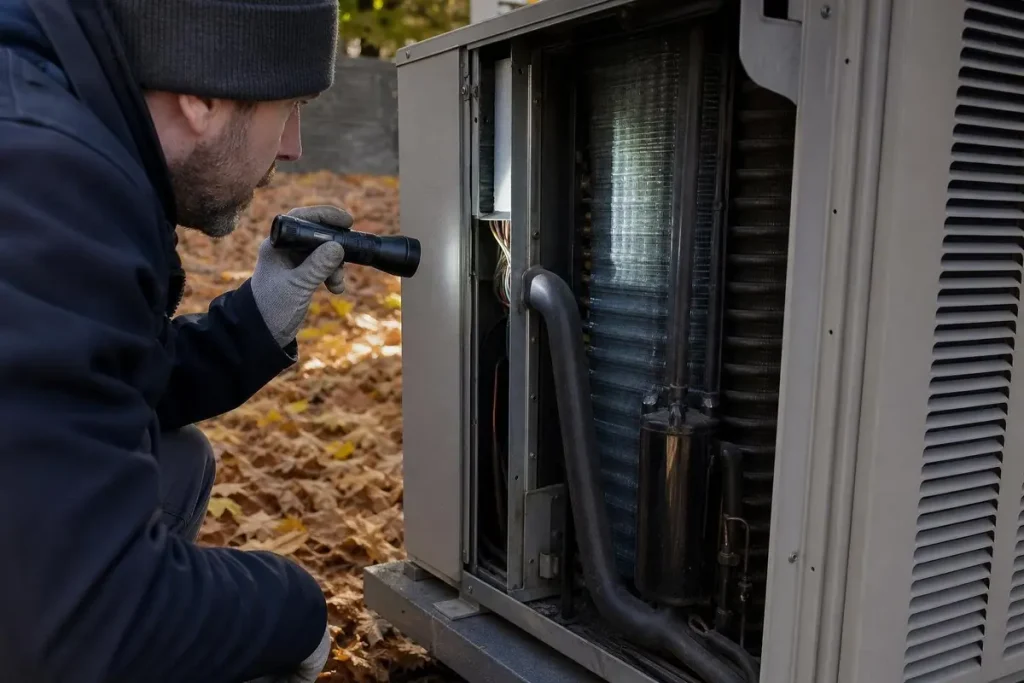
Divide your heating load in Btu by HSPF2 times 1,000 to get kilowatt hours, then multiply by your rate. DOE explains that HSPF is heat delivered per unit of electricity: a 10.3 HSPF heat pump provides 10,300 Btu per kWh. SEER works the same way for cooling.
- Estimate the season’s heating load in Btu (a contractor’s Manual J load calculation estimates it).
- Divide by HSPF2 x 1,000 to get heating kWh.
- Divide the cooling load in Btu by SEER2 x 1,000 to get cooling kWh.
- Multiply total kWh by your rate in dollars per kWh.
| Worked example, 18.16¢ per kWh | Rating | kWh | Season cost |
|---|---|---|---|
| Heating 30 million Btu, federal minimum split | 7.5 HSPF2 | 4,000 | $726 |
| Heating 30 million Btu, ENERGY STAR split | 7.8 HSPF2 | 3,846 | $698 |
| Heating 30 million Btu, higher rated | 9.0 HSPF2 | 3,333 | $605 |
| Heating 30 million Btu, resistance strips only | 3,412 Btu per kWh | 8,792 | $1,597 |
| Cooling 24 million Btu, federal minimum split | 14.3 SEER2 | 1,678 | $305 |
| Cooling 24 million Btu, ENERGY STAR split | 15.2 SEER2 | 1,579 | $287 |
The loads are illustrative inputs, not survey data. The ratings are real: 10 CFR 430.32(c)(5) sets 7.5 HSPF2 and 14.3 SEER2 for split heat pumps made on or after January 1, 2023, and ENERGY STAR requires at least 7.8 HSPF2 and 15.2 SEER2 for split systems. The regional rules are in our SEER2 minimum standards explainer, and how a heat pump moves heat covers why the ratio exceeds one.
Why is my electric bill so high with a heat pump in winter?
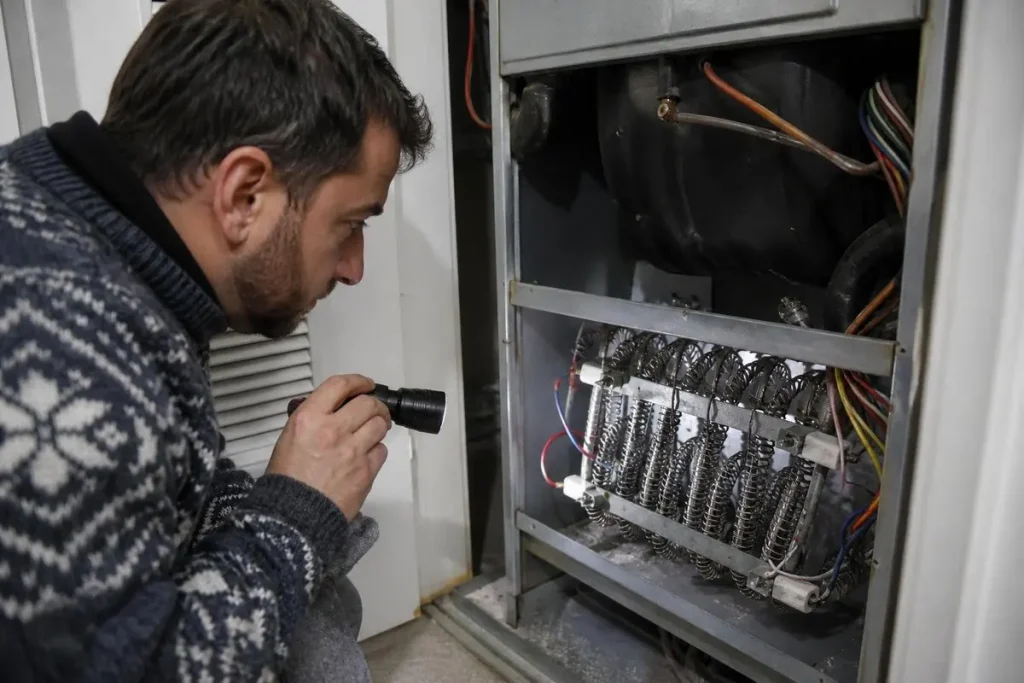
Usually because electric resistance heat is doing part of the work. Resistance strips deliver 3,412 Btu per kWh (EIA conversion factor), so every hour on strips costs about 2.2 times as much per unit of heat as a 7.5 HSPF2 heat pump averages over the season.
DOE describes a balance point, the outdoor temperature at which heat pump capacity equals the home’s heat loss, “usually well below 40°F for code-built homes”; below it, auxiliary heat makes up the gap. Space heaters add to the same meter: in 2020, 18.8% of heat pump homes used portable electric heaters as secondary heat, and EIA counts that electricity in the heating figures above. Our AUX and EM HEAT cost breakdown prices the strips, and the space heater running cost math covers the plug-in side.
Code point: strips should not fire on a small setpoint change
DOE says energy codes require heat pumps with auxiliary resistance heat to have controls that prevent unnecessary strip operation, and calls this one of the most commonly violated installation practices. Its example: at 50°F outdoors, raising the thermostat from 66°F to 70°F should never turn the strips on. Many controls are wired to do so after a change of more than 3°F. Requirements vary by local code.
Do ductless heat pumps cost less to run than central systems?
Ductless homes spent less, $859 a year against $1,025, but they were much smaller, so this is not a like-for-like efficiency comparison.
| Main heat pump type | Homes sampled | Heated sq ft, mean | Heating plus cooling kWh | Cost at Aug 2026 rates (SE) |
|---|---|---|---|---|
| Central (ducted) | 2,218 | 1,731 | 6,344 | $1,025 ($17) |
| Ductless mini-split | 154 | 1,061 | 4,578 | $859 ($67) |
| All heat pump homes | 2,372 | 1,689 | 6,235 | $1,015 ($16) |
Per heated square foot the ductless homes used more heating electricity, and they sit in colder places: 19.2% were in Cold zones against 8.2% of central systems, with 3,372 heating degree days in 2020 against 2,519. Whether a heat pump beats gas depends on your state’s gas and power prices; our state-by-state heat pump vs gas comparison and the delivered cost of heat by fuel handle that question.
How we researched this
Research date: October 28 to 29, 2026. Usage comes from the EIA Residential Energy Consumption Survey 2020 public microdata (v7, 18,496 homes), filtered to main heating equipment codes 4 (central heat pump) and 13 (ductless heat pump). Heating is KWHSPH plus KWHAHUHEAT; cooling is KWHCOL plus KWHAHUCOL. Means are weighted with NWEIGHT, and standard errors use EIA’s 60 jackknife replicate weights as described in its microdata guide. We dropped any cell under 30 sampled homes, stricter than EIA’s own rule of 10.
Costs multiply each home’s kWh by its state’s August 2026 residential price from EIA Table 5.6.A, a single month; seasonal rates and fixed charges will differ. Weather in 2026 also differs from 2020. Full 2024 RECS consumption data are due in spring 2027, per EIA, and we will update then. Sources consulted: 15; cited: 9. Excluded: vendor calculators with untraceable kWh averages, and forum threads. Freshness: four 2026 editions, one January 2026 archived copy, and 2020 usage data.
Frequently asked questions
How much does it cost to run a heat pump per month?
About $85 a month averaged over a year, for heating and cooling combined. That is the mean for US homes heated mainly by a heat pump: 6,235 kWh a year in EIA’s 2020 survey, priced at each state’s August 2026 rate. Bills are uneven across the year, peaking in the coldest and hottest months, and the median home pays less, about $73 a month.
Is it expensive to run a heat pump?
It depends mostly on climate and your electricity rate. Across 23 states with enough data, the mean annual heating and cooling cost ranged from $659 in California to $1,603 in West Virginia at August 2026 rates. Homes in Cold climate zones averaged $1,412, against $740 in Marine zones.
Is it cheaper to run a heat pump or an air conditioner?
In cooling mode they do the same job, so cost tracks the SEER2 rating. Under 10 CFR 430.32, split heat pumps made since 2023 must reach 14.3 SEER2, while the national floor for split air conditioners is 13.4 SEER2. A heat pump also heats, so its annual bill covers both seasons: 3,119 kWh cooling and 3,116 kWh heating on average.
Is it better to leave a heat pump running all the time?
Moderate, steady settings avoid the expensive part, which is resistance strip heat. DOE notes many controls switch strips on when the thermostat is raised more than 3°F, even in mild weather. If your system lacks controls that prevent this, a large morning setback recovery can bring the strips on, at about 2.2 times the cost per unit of heat of a 7.5 HSPF2 heat pump.
How many kWh does a heat pump use per year?
Heat pump homes used a mean of 6,235 kWh a year for heating and cooling in 2020, including air handler fans, according to EIA’s Residential Energy Consumption Survey. The median was 5,423 kWh. Heating averaged 3,116 kWh and cooling 3,119 kWh, though Cold-zone homes used 5,822 kWh for heat alone.
Why are these figures based on 2020 usage?
RECS 2020 is the latest survey with household end-use estimates; EIA says the full 2024 data set arrives in spring 2027. Kilowatt hours change slowly, so we reprice 2020 usage at August 2026 state rates. Total heating bills for all fuels are tracked in our average home heating bill study.
Sources
- US Energy Information Administration. “2020 RECS Microdata, v7.” https://www.eia.gov/consumption/residential/data/2020/index.php?view=microdata. Accessed October 2026.
- US Energy Information Administration. “Using the Microdata File to Compute Estimates and Standard Errors.” https://www.eia.gov/consumption/residential/data/2020/pdf/microdata-guide.pdf. Accessed October 2026.
- US Energy Information Administration. “Table HC6.1, Space heating in U.S. homes, 2020.” https://www.eia.gov/consumption/residential/data/2020/hc/xls/HC%206.1.xlsx. Accessed October 2026.
- US Energy Information Administration. “Electric Power Monthly, Table 5.6.A, August 2026.” https://www.eia.gov/electricity/monthly/epm_table_grapher.php?t=epmt_5_6_a. Accessed October 2026.
- Electronic Code of Federal Regulations. “10 CFR 430.32.” https://www.ecfr.gov/current/title-10/chapter-II/subchapter-D/part-430/subpart-C/section-430.32. Accessed October 2026.
- US Department of Energy, Energy Saver. “Air-Source Heat Pumps” (archived copy, January 1, 2026). https://web.archive.org/web/20260101025734id_/https://www.energy.gov/energysaver/air-source-heat-pumps. Accessed October 2026.
- ENERGY STAR. “Heat Pump Equipment Key Product Criteria.” https://www.energystar.gov/products/heating_cooling/heat_pumps_air_source/key_product_criteria. Accessed October 2026.
- US Energy Information Administration. “British thermal units (Btu).” https://www.eia.gov/energyexplained/units-and-calculators/british-thermal-units.php. Accessed October 2026.
- US Energy Information Administration. “Residential Energy Consumption Survey (RECS).” https://www.eia.gov/consumption/residential/. Accessed October 2026.
Leave a Reply